Montgomery County, Maryland Nativity & Citizenship Status (2024)
Place of birth and citizenship status analysis for Montgomery County, Maryland
Montgomery County, Maryland Nativity & Citizenship Indicators (2024)
Native Born
66.4%
Foreign Born
33.6%
Naturalized
19.4%
US Citizens
85.8%
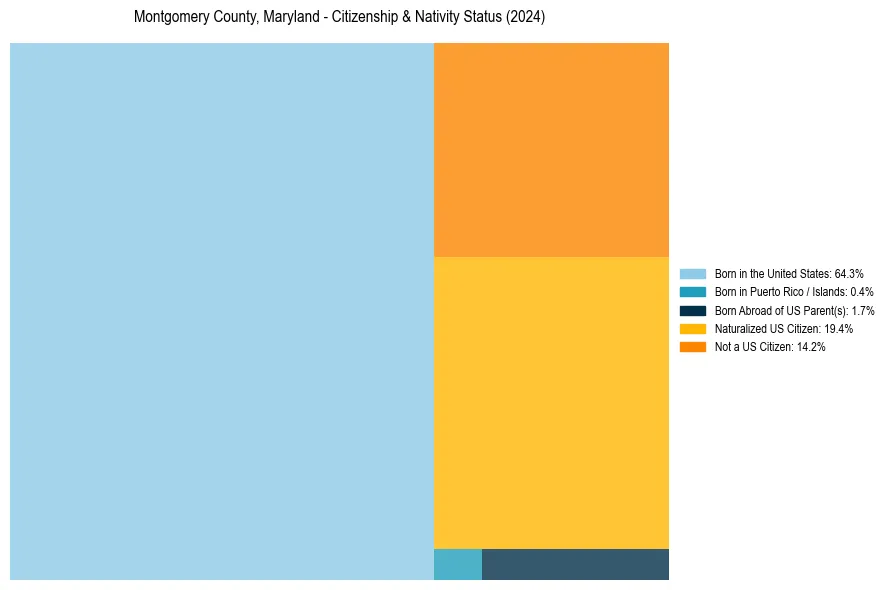
Montgomery County, Maryland Nativity & Citizenship Distribution
Montgomery County, Maryland Historical Nativity Trends (2010–2024)
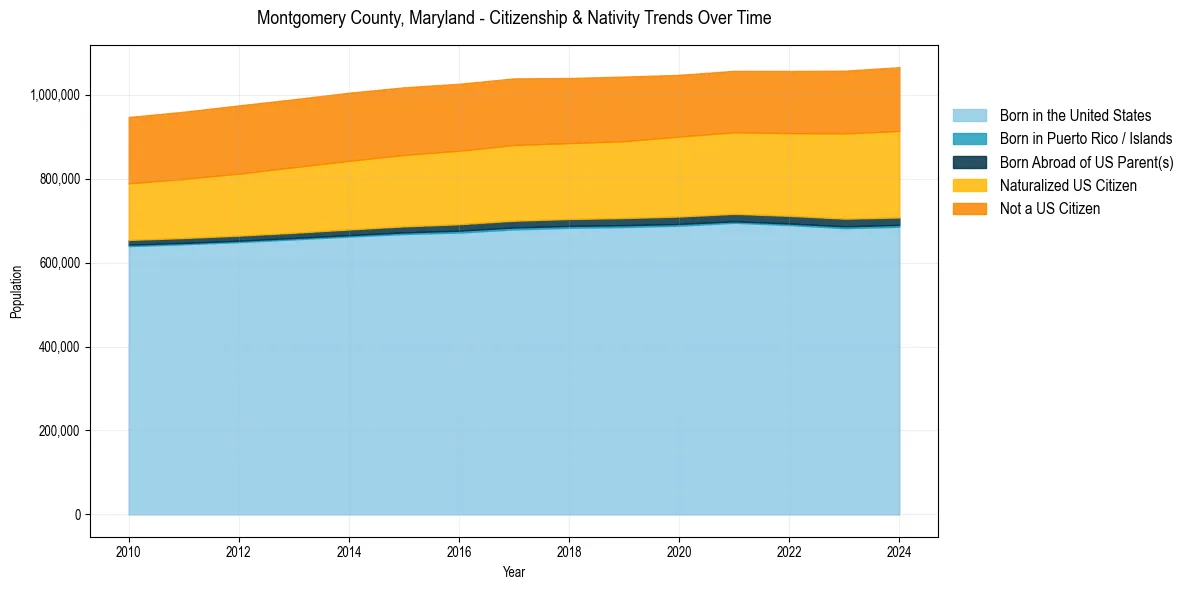
Montgomery County, Maryland Population & Nativity History
| Year | Total Pop | Foreign Born | Native Born |
|---|---|---|---|
| 2024 | 1,065,949 | 33.6% | 66.4% |
| 2023 | 1,057,586 | 33.4% | 66.6% |
| 2022 | 1,056,910 | 32.7% | 67.3% |
| 2021 | 1,057,201 | 32.2% | 67.8% |
| 2020 | 1,047,661 | 32.2% | 67.8% |
| 2019 | 1,043,530 | 32.3% | 67.7% |
| 2018 | 1,040,133 | 32.3% | 67.7% |
| 2017 | 1,039,198 | 32.6% | 67.4% |
| 2016 | 1,026,371 | 32.6% | 67.4% |
| 2015 | 1,017,859 | 32.6% | 67.4% |
| 2014 | 1,005,087 | 32.4% | 67.6% |
| 2013 | 989,474 | 32.2% | 67.8% |
| 2012 | 974,824 | 31.8% | 68.2% |
| 2011 | 959,738 | 31.4% | 68.6% |
| 2010 | 947,230 | 30.9% | 69.1% |
Nativity & Citizenship FAQs for Montgomery County, Maryland
Approximately 33.6% of residents in Montgomery County, Maryland were born outside the United States.
The vast majority of residents, roughly 85.8%, are U.S. citizens (including both native-born and naturalized citizens).