Montgomery County, Maryland Health Insurance Coverage (2024)
Detailed analysis of uninsured rates and coverage trends for Montgomery County, Maryland
Universe
1,056,471
Total Uninsured
73,432
Uninsured Rate
7.0%
Coverage by Age and Gender
Distribution of insured vs. uninsured residents in Montgomery County, Maryland
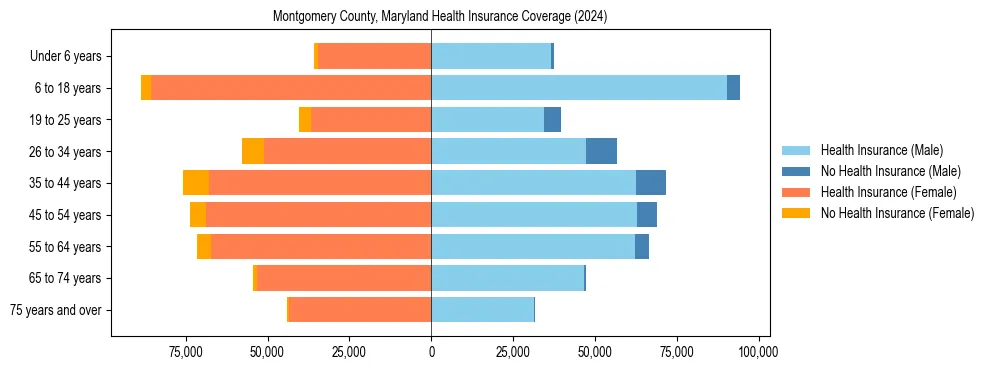
Uninsured Rates by Demographic Group
Under 18 Years
Male Uninsured3.8%
Female Uninsured3.3%
18 to 34 Years
Male Uninsured15.2%
Female Uninsured10.5%
35 to 64 Years
Male Uninsured9.4%
Female Uninsured7.6%
65 Years & Over
Male Uninsured1.5%
Female Uninsured1.9%
Uninsured Rate Trends
Historical coverage data from 2012 to 2024
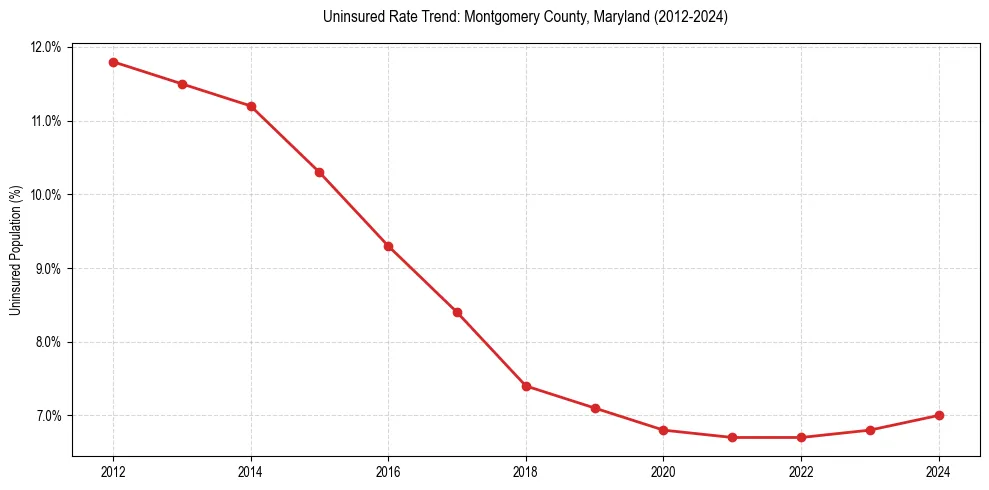
| Year | Total Uninsured | Uninsured Rate |
|---|---|---|
| 2024 | 73,432 | 7.0% |
| 2023 | 71,671 | 6.8% |
| 2022 | 70,290 | 6.7% |
| 2021 | 69,852 | 6.7% |
| 2020 | 70,331 | 6.8% |
| 2019 | 73,916 | 7.1% |
| 2018 | 76,522 | 7.4% |
| 2017 | 86,606 | 8.4% |
| 2016 | 94,249 | 9.3% |
| 2015 | 103,522 | 10.3% |
| 2014 | 111,190 | 11.2% |
| 2013 | 112,942 | 11.5% |
| 2012 | 113,918 | 11.8% |
Frequently Asked Questions
Approximately 7.0% of the population in Montgomery County, Maryland does not have health insurance coverage.
In Montgomery County, Maryland, young adult males (18-34) face the highest barrier to coverage, with an uninsured rate of 15.2%. This is notably higher than the overall local average of 7.0%.