Harford County, Maryland Nativity & Citizenship Status (2024)
Place of birth and citizenship status analysis for Harford County, Maryland
Harford County, Maryland Nativity & Citizenship Indicators (2024)
Native Born
94.1%
Foreign Born
5.9%
Naturalized
4.0%
US Citizens
98.0%
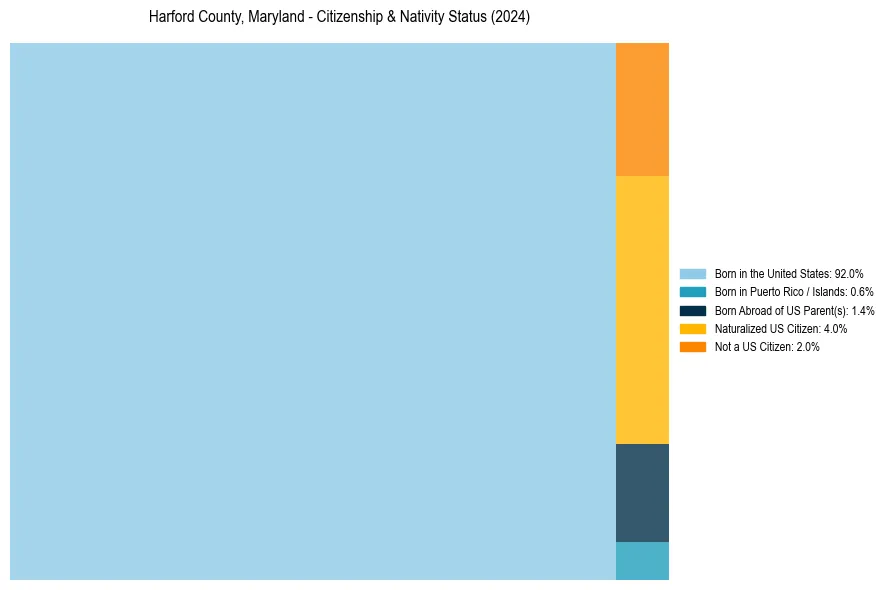
Harford County, Maryland Nativity & Citizenship Distribution
Harford County, Maryland Historical Nativity Trends (2010–2024)
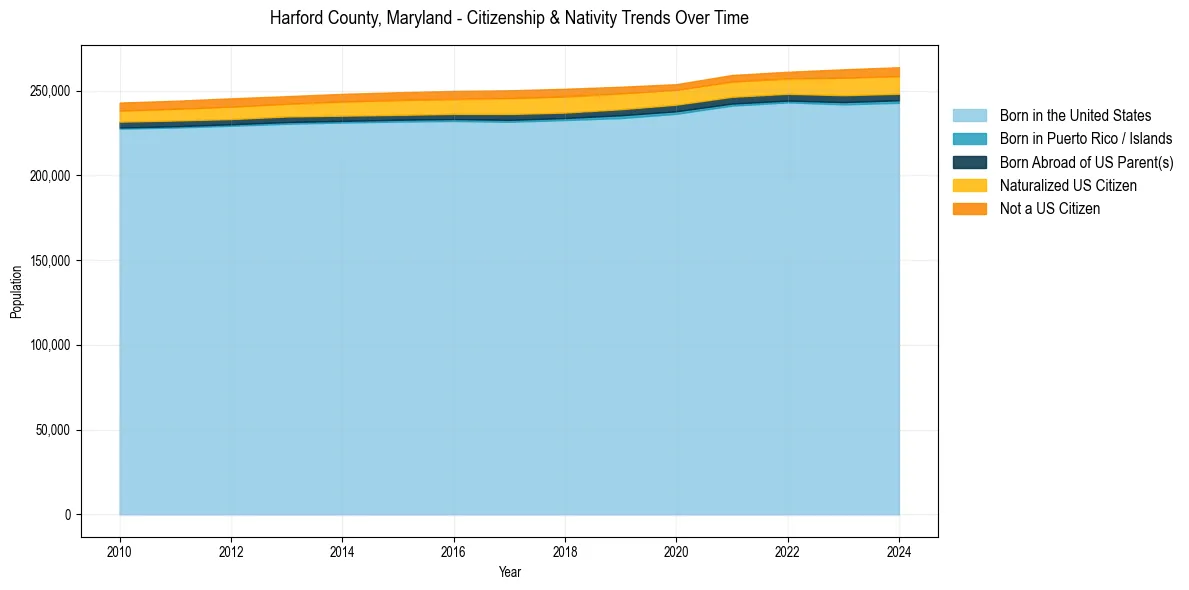
Harford County, Maryland Population & Nativity History
| Year | Total Pop | Foreign Born | Native Born |
|---|---|---|---|
| 2024 | 263,757 | 5.9% | 94.1% |
| 2023 | 262,509 | 5.8% | 94.2% |
| 2022 | 261,059 | 5.0% | 95.0% |
| 2021 | 259,162 | 5.0% | 95.0% |
| 2020 | 253,736 | 4.8% | 95.2% |
| 2019 | 252,222 | 5.3% | 94.7% |
| 2018 | 251,025 | 5.6% | 94.4% |
| 2017 | 250,132 | 5.6% | 94.4% |
| 2016 | 249,776 | 5.4% | 94.6% |
| 2015 | 248,966 | 5.4% | 94.6% |
| 2014 | 248,029 | 5.2% | 94.8% |
| 2013 | 246,664 | 4.9% | 95.1% |
| 2012 | 245,396 | 5.0% | 95.0% |
| 2011 | 243,955 | 4.8% | 95.2% |
| 2010 | 242,888 | 4.6% | 95.4% |
Nativity & Citizenship FAQs for Harford County, Maryland
Approximately 5.9% of residents in Harford County, Maryland were born outside the United States.
The vast majority of residents, roughly 98.0%, are U.S. citizens (including both native-born and naturalized citizens).