Frederick County, Maryland Nativity & Citizenship Status (2024)
Place of birth and citizenship status analysis for Frederick County, Maryland
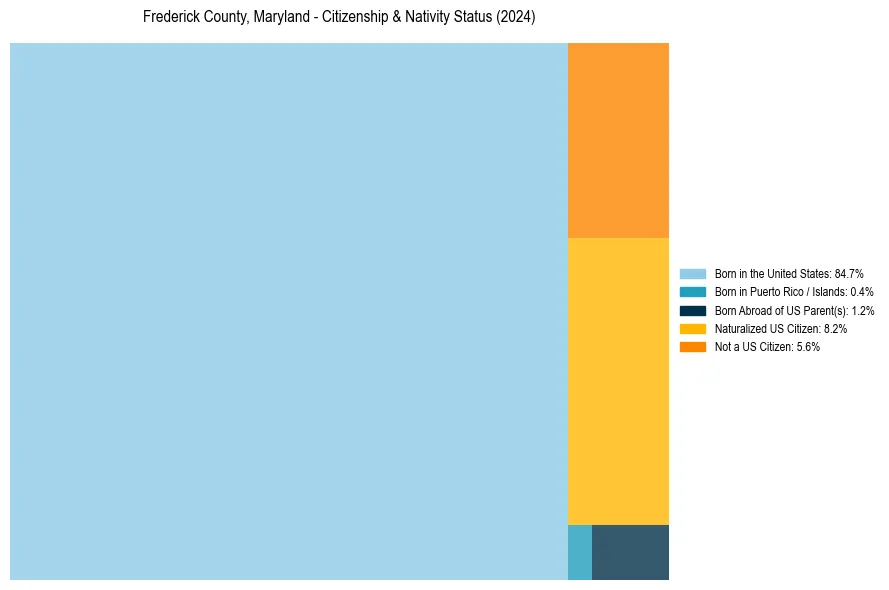
Frederick County, Maryland Nativity & Citizenship Indicators (2024)
Native Born
86.2%
Foreign Born
13.8%
Naturalized
8.2%
US Citizens
94.4%
Frederick County, Maryland Nativity & Citizenship Distribution
Frederick County, Maryland Historical Nativity Trends (2010–2024)
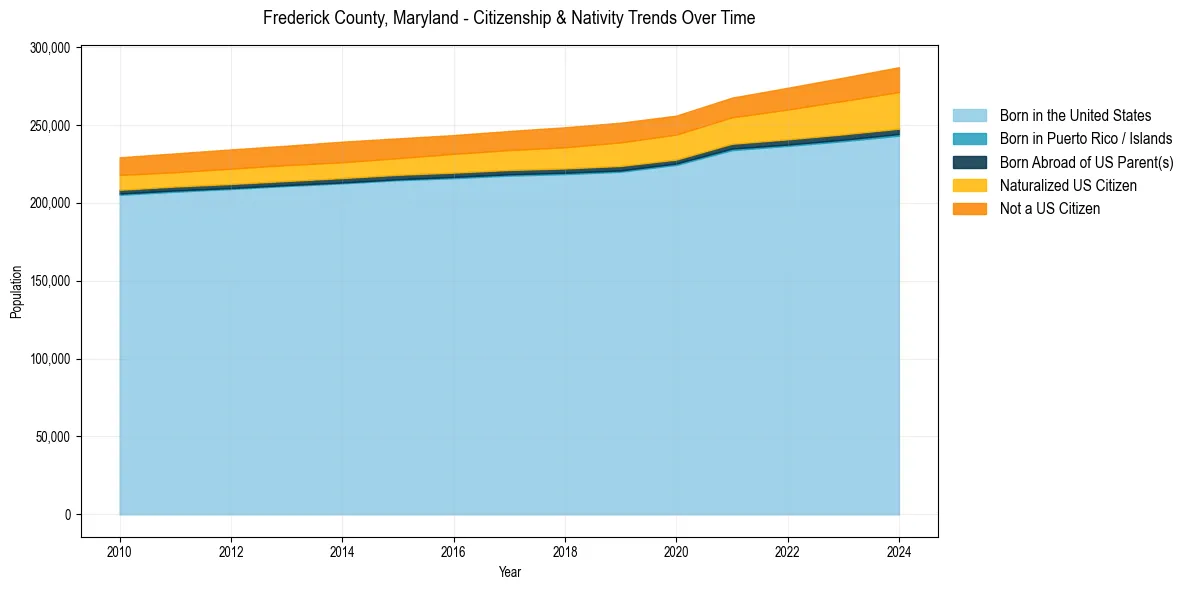
Frederick County, Maryland Population & Nativity History
| Year | Total Pop | Foreign Born | Native Born |
|---|---|---|---|
| 2024 | 287,048 | 13.8% | 86.2% |
| 2023 | 280,341 | 13.0% | 87.0% |
| 2022 | 273,829 | 12.1% | 87.9% |
| 2021 | 267,498 | 11.1% | 88.9% |
| 2020 | 255,955 | 11.0% | 89.0% |
| 2019 | 251,422 | 11.0% | 89.0% |
| 2018 | 248,472 | 10.6% | 89.4% |
| 2017 | 246,105 | 10.2% | 89.8% |
| 2016 | 243,465 | 9.9% | 90.1% |
| 2015 | 241,373 | 9.7% | 90.3% |
| 2014 | 239,253 | 9.8% | 90.2% |
| 2013 | 236,668 | 9.6% | 90.4% |
| 2012 | 234,268 | 9.5% | 90.5% |
| 2011 | 231,725 | 9.2% | 90.8% |
| 2010 | 229,205 | 9.1% | 90.9% |
Nativity & Citizenship FAQs for Frederick County, Maryland
Approximately 13.8% of residents in Frederick County, Maryland were born outside the United States.
The vast majority of residents, roughly 94.4%, are U.S. citizens (including both native-born and naturalized citizens).