Charles County, Maryland Nativity & Citizenship Status (2024)
Place of birth and citizenship status analysis for Charles County, Maryland
Charles County, Maryland Nativity & Citizenship Indicators (2024)
Native Born
91.5%
Foreign Born
8.5%
Naturalized
5.1%
US Citizens
96.6%
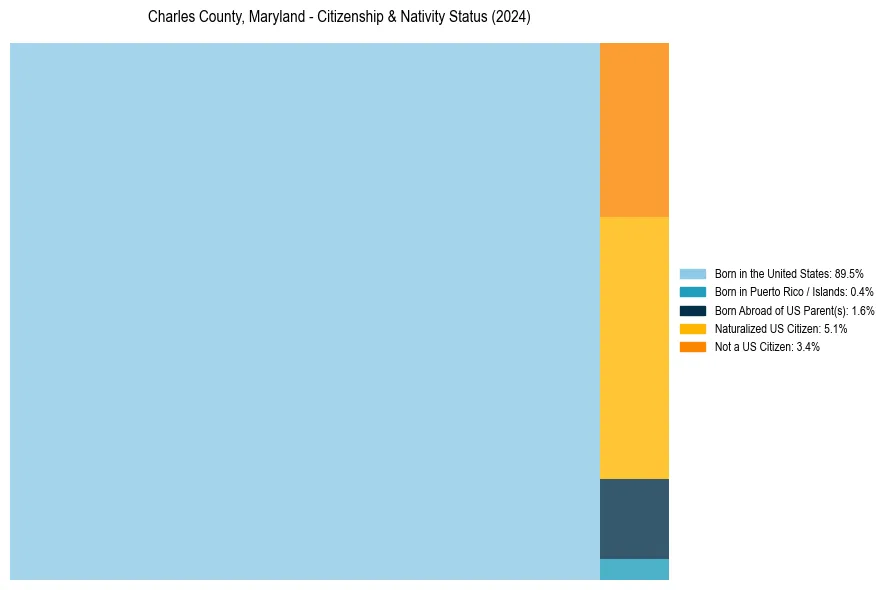
Charles County, Maryland Nativity & Citizenship Distribution
Charles County, Maryland Historical Nativity Trends (2010–2024)
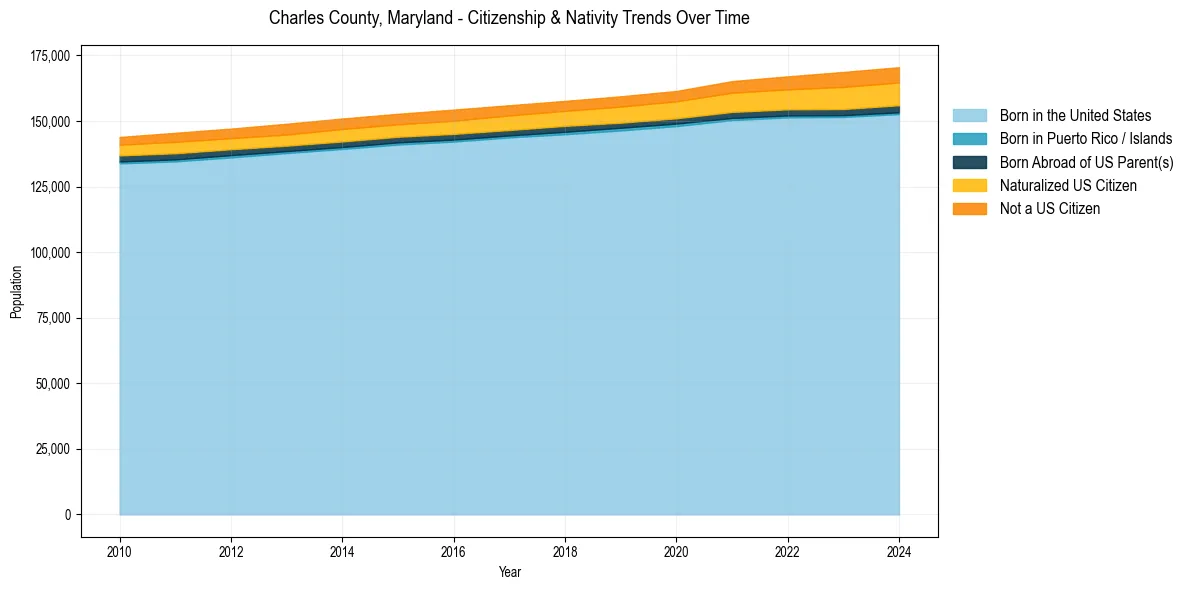
Charles County, Maryland Population & Nativity History
| Year | Total Pop | Foreign Born | Native Born |
|---|---|---|---|
| 2024 | 170,527 | 8.5% | 91.5% |
| 2023 | 168,710 | 8.4% | 91.6% |
| 2022 | 167,035 | 7.5% | 92.5% |
| 2021 | 165,209 | 7.1% | 92.9% |
| 2020 | 161,448 | 6.5% | 93.5% |
| 2019 | 159,428 | 6.3% | 93.7% |
| 2018 | 157,671 | 6.0% | 94.0% |
| 2017 | 156,021 | 6.1% | 93.9% |
| 2016 | 154,357 | 6.0% | 94.0% |
| 2015 | 152,754 | 5.7% | 94.3% |
| 2014 | 150,960 | 5.8% | 94.2% |
| 2013 | 148,957 | 5.6% | 94.4% |
| 2012 | 147,107 | 5.4% | 94.6% |
| 2011 | 145,508 | 5.4% | 94.6% |
| 2010 | 143,912 | 4.9% | 95.1% |
Nativity & Citizenship FAQs for Charles County, Maryland
Approximately 8.5% of residents in Charles County, Maryland were born outside the United States.
The vast majority of residents, roughly 96.6%, are U.S. citizens (including both native-born and naturalized citizens).