Carroll County, Maryland Nativity & Citizenship Status (2024)
Place of birth and citizenship status analysis for Carroll County, Maryland
Carroll County, Maryland Nativity & Citizenship Indicators (2024)
Native Born
94.5%
Foreign Born
5.5%
Naturalized
3.1%
US Citizens
97.7%
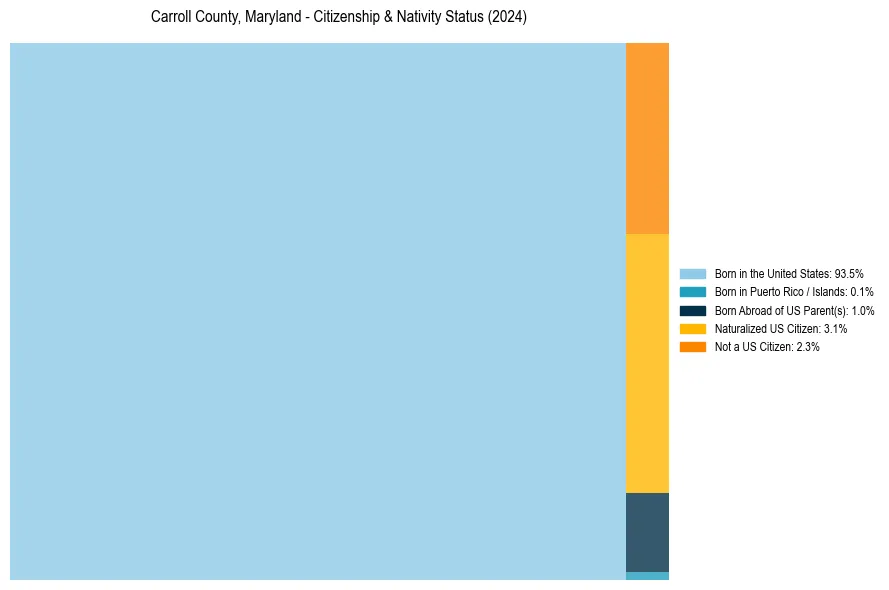
Carroll County, Maryland Nativity & Citizenship Distribution
Carroll County, Maryland Historical Nativity Trends (2010–2024)
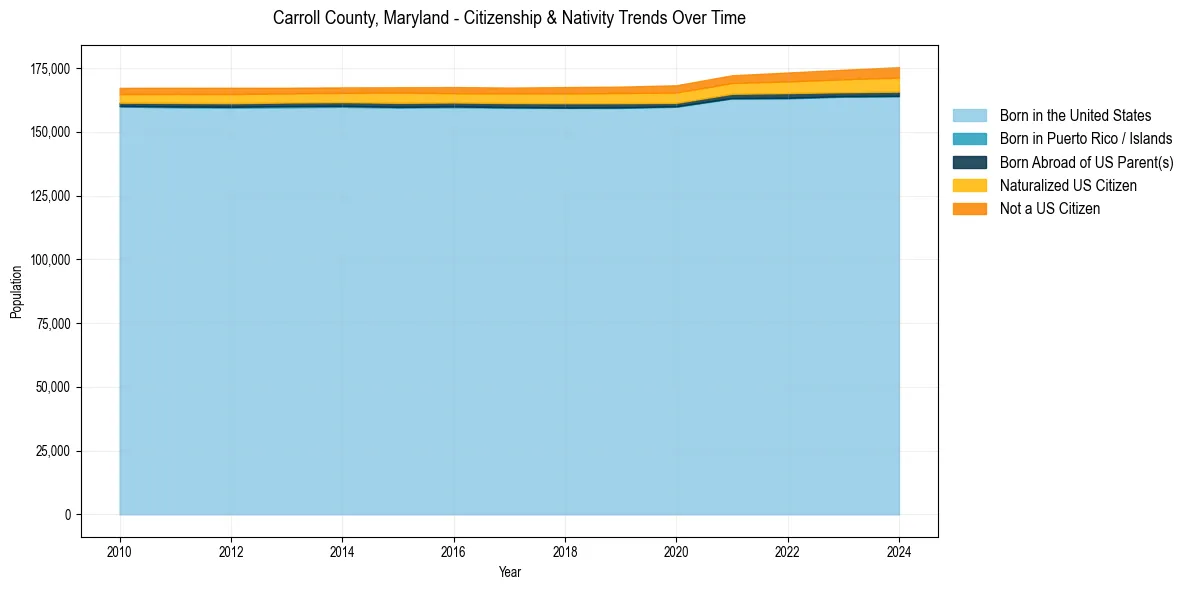
Carroll County, Maryland Population & Nativity History
| Year | Total Pop | Foreign Born | Native Born |
|---|---|---|---|
| 2024 | 175,321 | 5.5% | 94.5% |
| 2023 | 174,318 | 5.0% | 95.0% |
| 2022 | 173,225 | 4.7% | 95.3% |
| 2021 | 172,148 | 4.2% | 95.8% |
| 2020 | 168,233 | 4.1% | 95.9% |
| 2019 | 167,699 | 3.9% | 96.1% |
| 2018 | 167,522 | 3.8% | 96.2% |
| 2017 | 167,319 | 3.6% | 96.4% |
| 2016 | 167,535 | 3.6% | 96.4% |
| 2015 | 167,444 | 3.6% | 96.4% |
| 2014 | 167,399 | 3.4% | 96.6% |
| 2013 | 167,261 | 3.5% | 96.5% |
| 2012 | 167,249 | 3.6% | 96.4% |
| 2011 | 167,277 | 3.6% | 96.4% |
| 2010 | 167,208 | 3.5% | 96.5% |
Nativity & Citizenship FAQs for Carroll County, Maryland
Approximately 5.5% of residents in Carroll County, Maryland were born outside the United States.
The vast majority of residents, roughly 97.7%, are U.S. citizens (including both native-born and naturalized citizens).