Calvert County, Maryland Nativity & Citizenship Status (2024)
Place of birth and citizenship status analysis for Calvert County, Maryland
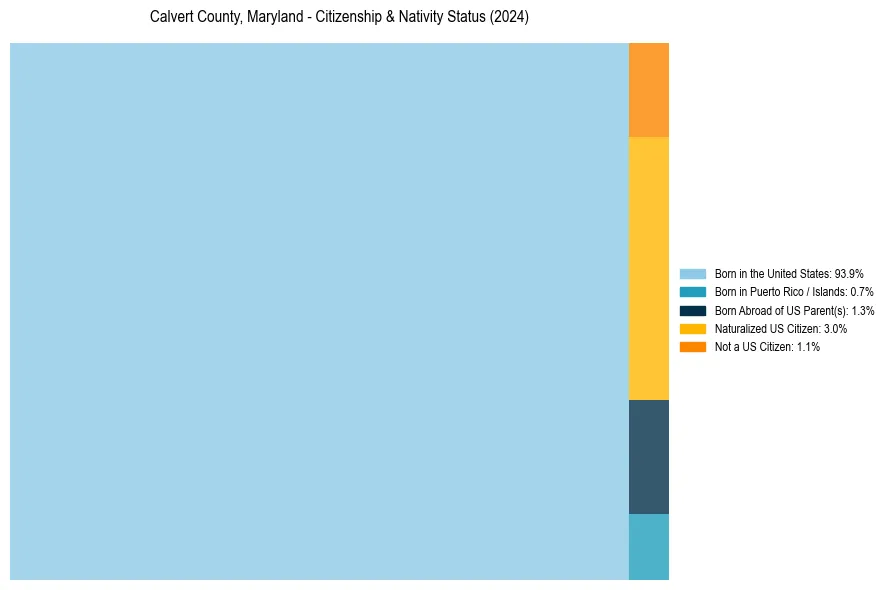
Calvert County, Maryland Nativity & Citizenship Indicators (2024)
Native Born
96.0%
Foreign Born
4.0%
Naturalized
3.0%
US Citizens
98.9%
Calvert County, Maryland Nativity & Citizenship Distribution
Calvert County, Maryland Historical Nativity Trends (2010–2024)
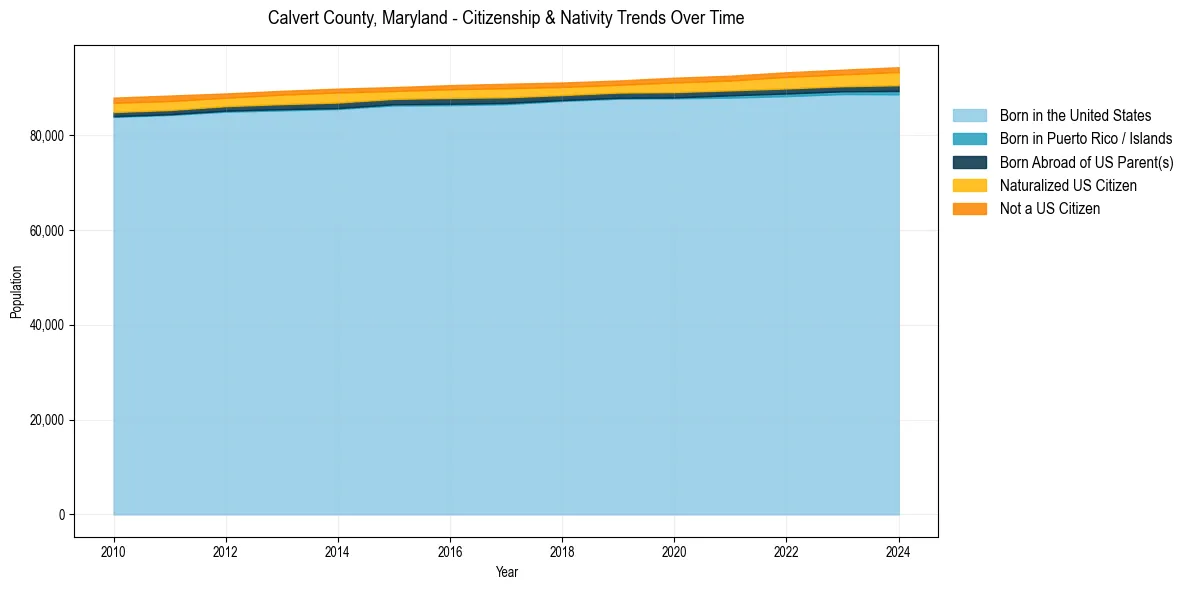
Calvert County, Maryland Population & Nativity History
| Year | Total Pop | Foreign Born | Native Born |
|---|---|---|---|
| 2024 | 94,313 | 4.0% | 96.0% |
| 2023 | 93,791 | 3.7% | 96.3% |
| 2022 | 93,244 | 3.7% | 96.3% |
| 2021 | 92,515 | 3.3% | 96.7% |
| 2020 | 92,094 | 3.3% | 96.7% |
| 2019 | 91,511 | 2.8% | 97.2% |
| 2018 | 91,082 | 2.9% | 97.1% |
| 2017 | 90,824 | 3.2% | 96.8% |
| 2016 | 90,527 | 3.0% | 97.0% |
| 2015 | 90,114 | 2.8% | 97.2% |
| 2014 | 89,793 | 3.3% | 96.7% |
| 2013 | 89,332 | 3.1% | 96.9% |
| 2012 | 88,774 | 3.0% | 97.0% |
| 2011 | 88,329 | 3.5% | 96.5% |
| 2010 | 87,891 | 3.5% | 96.5% |
Nativity & Citizenship FAQs for Calvert County, Maryland
Approximately 4.0% of residents in Calvert County, Maryland were born outside the United States.
The vast majority of residents, roughly 98.9%, are U.S. citizens (including both native-born and naturalized citizens).