Baltimore County, Maryland Nativity & Citizenship Status (2024)
Place of birth and citizenship status analysis for Baltimore County, Maryland
Baltimore County, Maryland Nativity & Citizenship Indicators (2024)
Native Born
86.8%
Foreign Born
13.2%
Naturalized
7.9%
US Citizens
94.8%
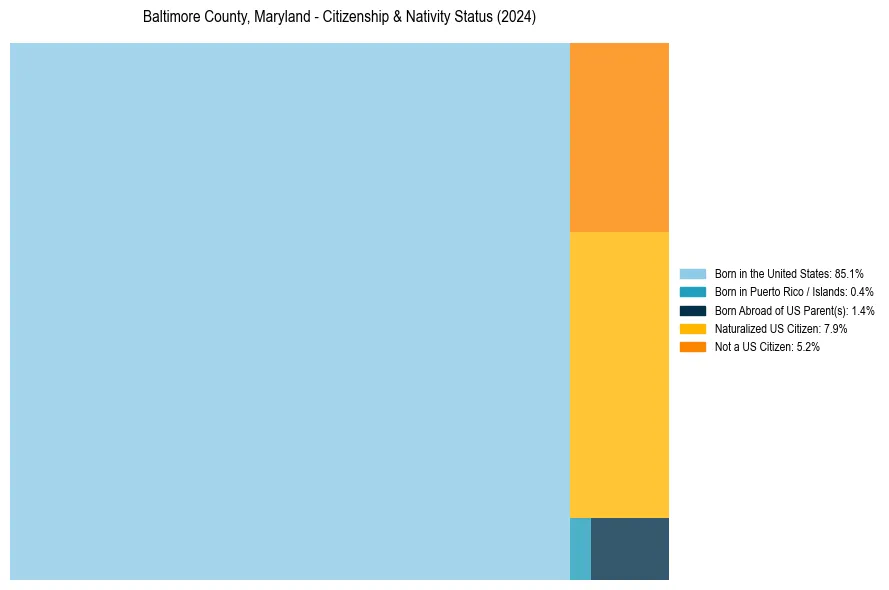
Baltimore County, Maryland Nativity & Citizenship Distribution
Baltimore County, Maryland Historical Nativity Trends (2010–2024)
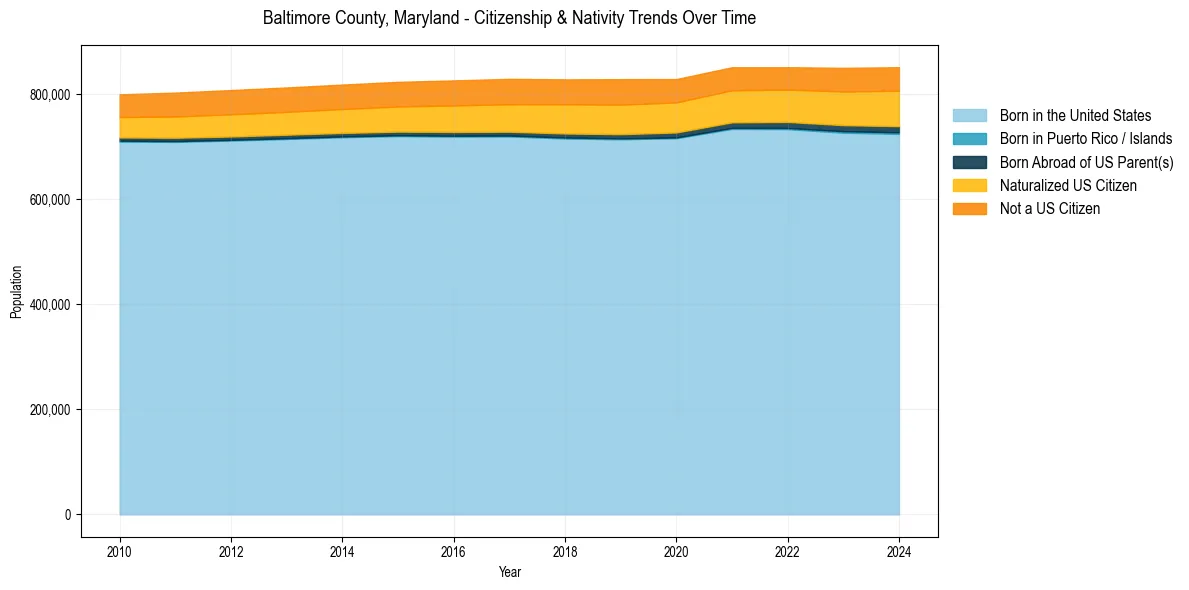
Baltimore County, Maryland Population & Nativity History
| Year | Total Pop | Foreign Born | Native Born |
|---|---|---|---|
| 2024 | 850,796 | 13.2% | 86.8% |
| 2023 | 849,586 | 12.8% | 87.2% |
| 2022 | 850,737 | 12.2% | 87.8% |
| 2021 | 850,702 | 12.3% | 87.7% |
| 2020 | 828,193 | 12.3% | 87.7% |
| 2019 | 828,018 | 12.6% | 87.4% |
| 2018 | 827,625 | 12.4% | 87.6% |
| 2017 | 828,637 | 12.1% | 87.9% |
| 2016 | 825,666 | 11.9% | 88.1% |
| 2015 | 822,959 | 11.5% | 88.5% |
| 2014 | 817,720 | 11.2% | 88.8% |
| 2013 | 812,261 | 11.1% | 88.9% |
| 2012 | 807,318 | 10.9% | 89.1% |
| 2011 | 802,487 | 10.7% | 89.3% |
| 2010 | 799,195 | 10.3% | 89.7% |
Nativity & Citizenship FAQs for Baltimore County, Maryland
Approximately 13.2% of residents in Baltimore County, Maryland were born outside the United States.
The vast majority of residents, roughly 94.8%, are U.S. citizens (including both native-born and naturalized citizens).