Baltimore city, Maryland Nativity & Citizenship Status (2024)
Place of birth and citizenship status analysis for Baltimore city, Maryland
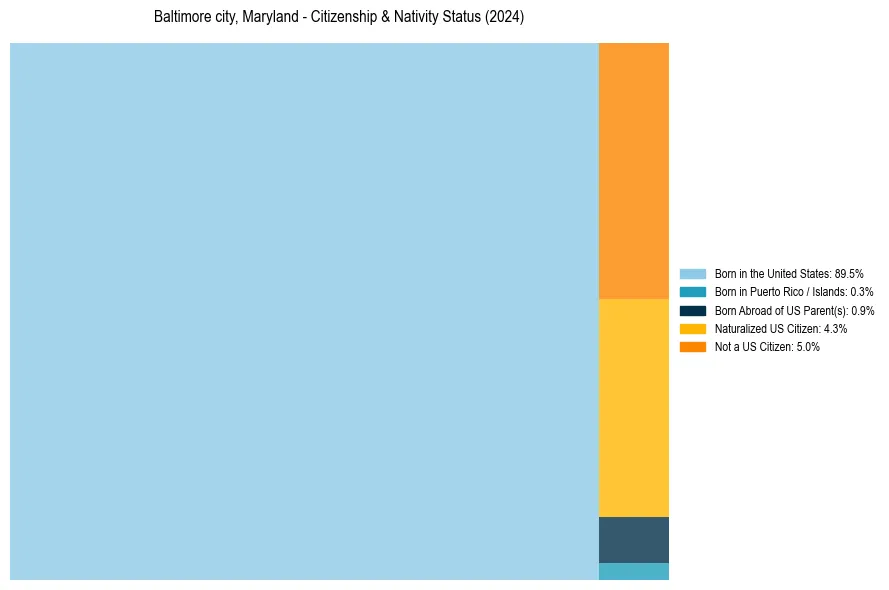
Baltimore city, Maryland Nativity & Citizenship Indicators (2024)
Native Born
90.7%
Foreign Born
9.3%
Naturalized
4.3%
US Citizens
95.0%
Baltimore city, Maryland Nativity & Citizenship Distribution
Baltimore city, Maryland Historical Nativity Trends (2010–2024)
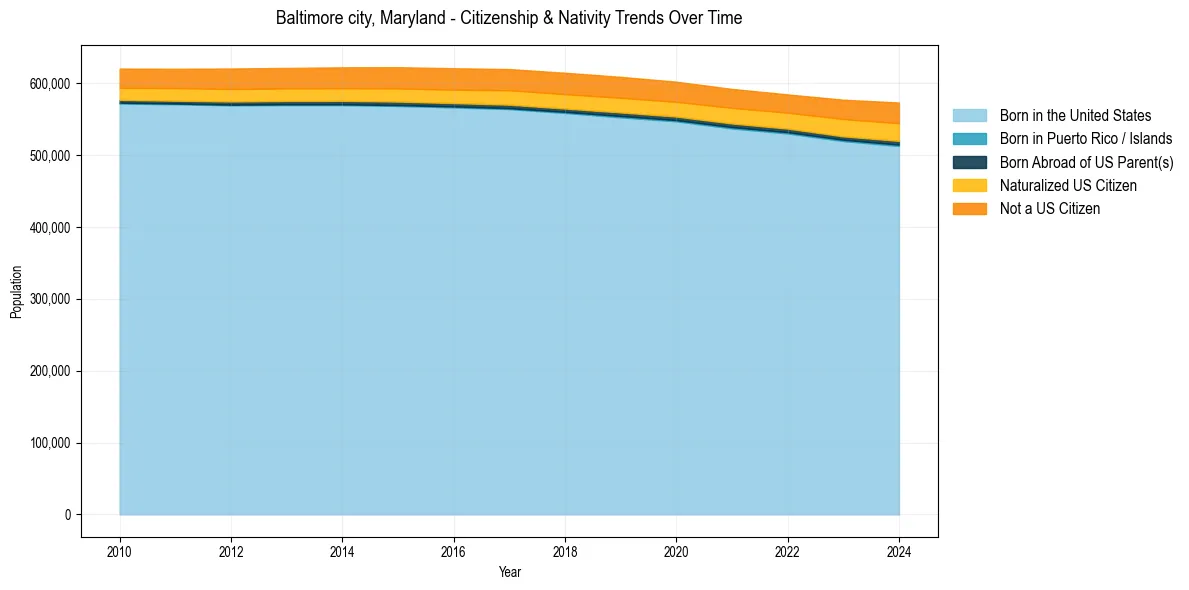
Baltimore city, Maryland Population & Nativity History
| Year | Total Pop | Foreign Born | Native Born |
|---|---|---|---|
| 2024 | 573,243 | 9.3% | 90.7% |
| 2023 | 577,193 | 8.8% | 91.2% |
| 2022 | 584,548 | 8.1% | 91.9% |
| 2021 | 592,211 | 8.1% | 91.9% |
| 2020 | 602,274 | 8.1% | 91.9% |
| 2019 | 609,032 | 8.1% | 91.9% |
| 2018 | 614,700 | 8.1% | 91.9% |
| 2017 | 619,796 | 8.0% | 92.0% |
| 2016 | 621,000 | 7.8% | 92.2% |
| 2015 | 622,454 | 7.7% | 92.3% |
| 2014 | 622,271 | 7.5% | 92.5% |
| 2013 | 621,445 | 7.4% | 92.6% |
| 2012 | 620,644 | 7.4% | 92.6% |
| 2011 | 620,210 | 7.2% | 92.8% |
| 2010 | 620,538 | 7.0% | 93.0% |
Nativity & Citizenship FAQs for Baltimore city, Maryland
Approximately 9.3% of residents in Baltimore city, Maryland were born outside the United States.
The vast majority of residents, roughly 95.0%, are U.S. citizens (including both native-born and naturalized citizens).