Anne Arundel County, Maryland Nativity & Citizenship Status (2024)
Place of birth and citizenship status analysis for Anne Arundel County, Maryland
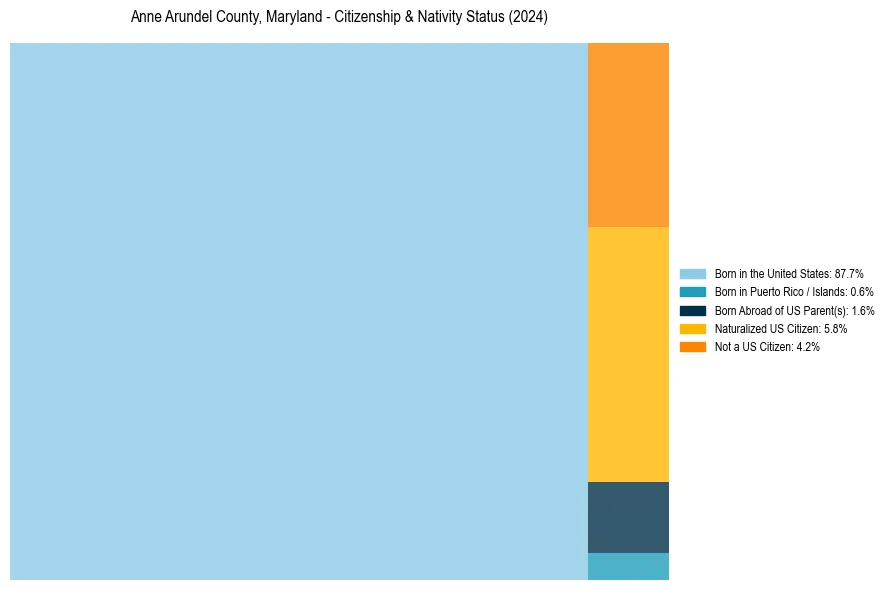
Anne Arundel County, Maryland Nativity & Citizenship Indicators (2024)
Native Born
90.0%
Foreign Born
10.0%
Naturalized
5.8%
US Citizens
95.8%
Anne Arundel County, Maryland Nativity & Citizenship Distribution
Anne Arundel County, Maryland Historical Nativity Trends (2010–2024)
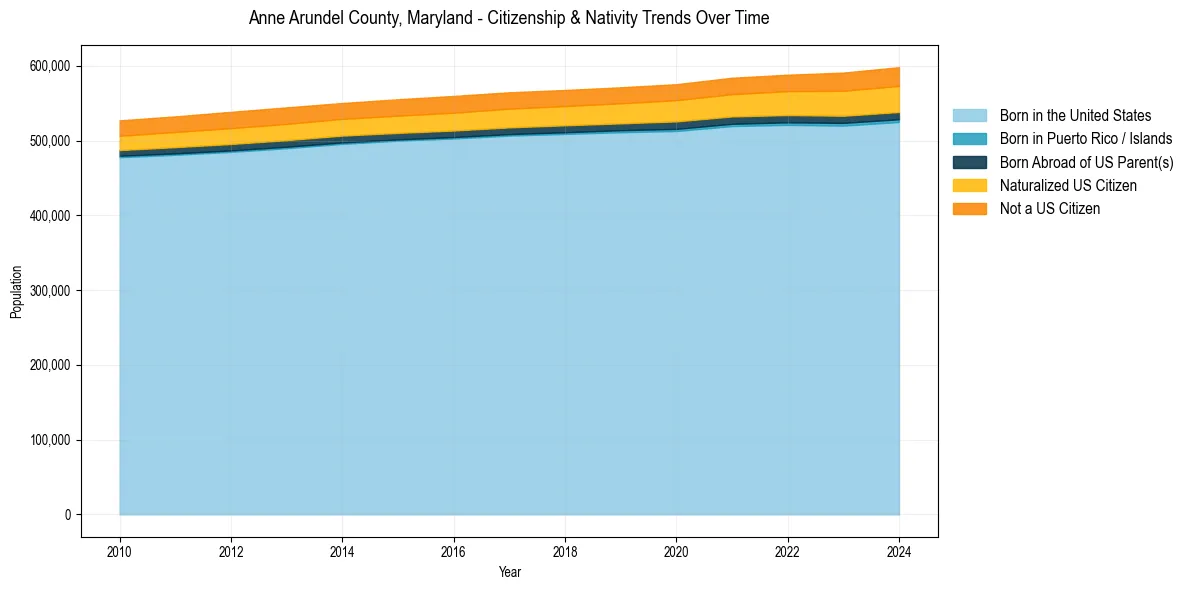
Anne Arundel County, Maryland Population & Nativity History
| Year | Total Pop | Foreign Born | Native Born |
|---|---|---|---|
| 2024 | 598,166 | 10.0% | 90.0% |
| 2023 | 590,936 | 9.8% | 90.2% |
| 2022 | 588,109 | 9.2% | 90.8% |
| 2021 | 584,064 | 8.9% | 91.1% |
| 2020 | 575,421 | 8.6% | 91.4% |
| 2019 | 571,275 | 8.4% | 91.6% |
| 2018 | 567,696 | 8.3% | 91.7% |
| 2017 | 564,600 | 8.3% | 91.7% |
| 2016 | 559,737 | 8.3% | 91.7% |
| 2015 | 555,280 | 8.1% | 91.9% |
| 2014 | 550,269 | 7.9% | 92.1% |
| 2013 | 544,426 | 8.1% | 91.9% |
| 2012 | 538,473 | 8.0% | 92.0% |
| 2011 | 532,369 | 7.7% | 92.3% |
| 2010 | 527,020 | 7.5% | 92.5% |
Nativity & Citizenship FAQs for Anne Arundel County, Maryland
Approximately 10.0% of residents in Anne Arundel County, Maryland were born outside the United States.
The vast majority of residents, roughly 95.8%, are U.S. citizens (including both native-born and naturalized citizens).