Allegany County, Maryland Nativity & Citizenship Status (2024)
Place of birth and citizenship status analysis for Allegany County, Maryland
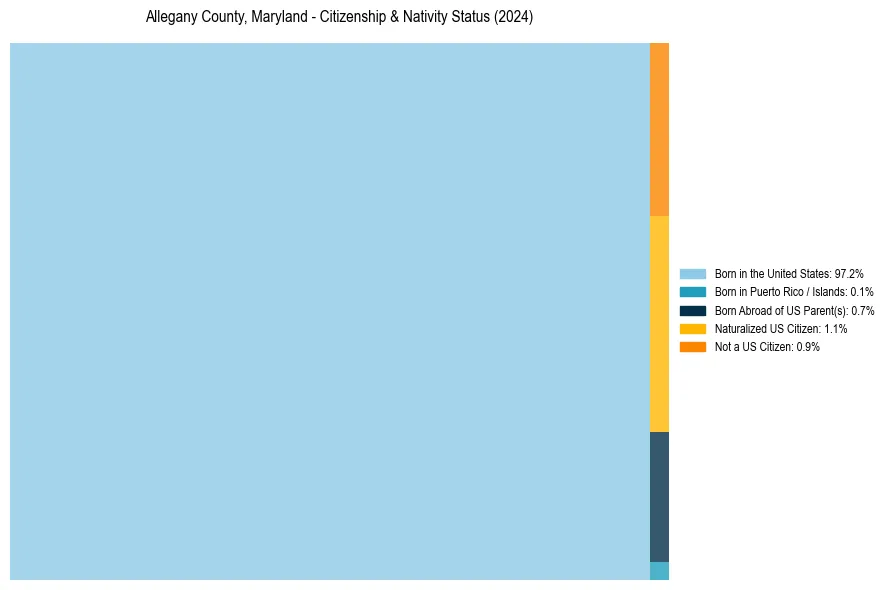
Allegany County, Maryland Nativity & Citizenship Indicators (2024)
Native Born
97.9%
Foreign Born
2.1%
Naturalized
1.1%
US Citizens
99.1%
Allegany County, Maryland Nativity & Citizenship Distribution
Allegany County, Maryland Historical Nativity Trends (2010–2024)
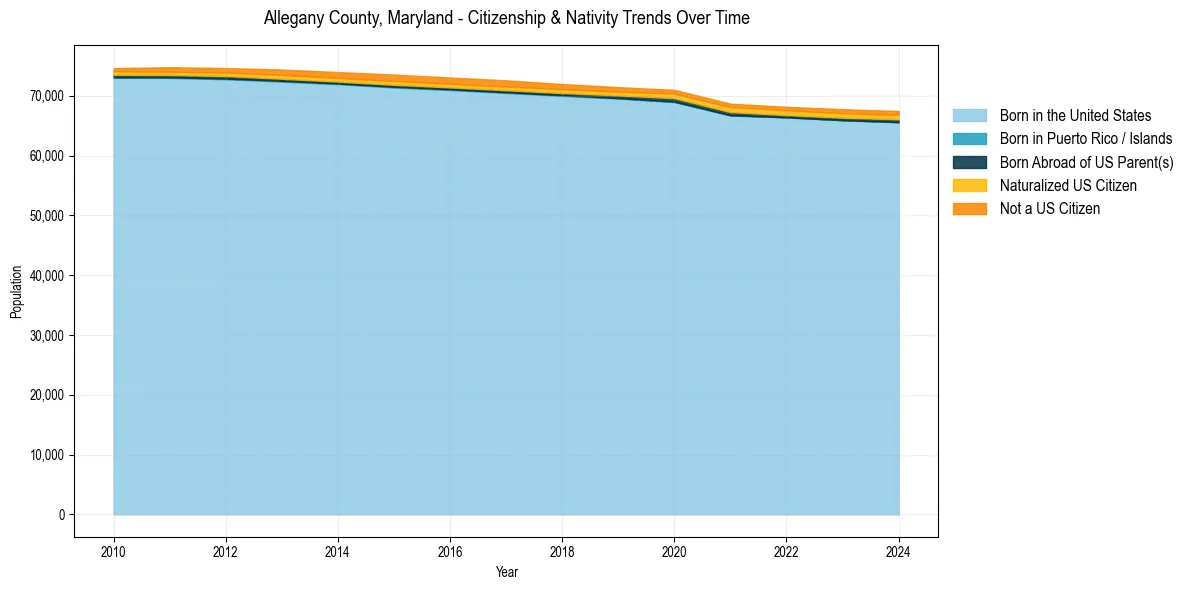
Allegany County, Maryland Population & Nativity History
| Year | Total Pop | Foreign Born | Native Born |
|---|---|---|---|
| 2024 | 67,452 | 2.1% | 97.9% |
| 2023 | 67,762 | 2.1% | 97.9% |
| 2022 | 68,161 | 2.0% | 98.0% |
| 2021 | 68,684 | 2.0% | 98.0% |
| 2020 | 71,002 | 2.0% | 98.0% |
| 2019 | 71,445 | 1.9% | 98.1% |
| 2018 | 71,977 | 2.1% | 97.9% |
| 2017 | 72,591 | 2.3% | 97.7% |
| 2016 | 73,060 | 2.3% | 97.7% |
| 2015 | 73,549 | 2.3% | 97.7% |
| 2014 | 73,976 | 2.2% | 97.8% |
| 2013 | 74,394 | 2.1% | 97.9% |
| 2012 | 74,645 | 1.8% | 98.2% |
| 2011 | 74,788 | 1.8% | 98.2% |
| 2010 | 74,638 | 1.5% | 98.5% |
Nativity & Citizenship FAQs for Allegany County, Maryland
Approximately 2.1% of residents in Allegany County, Maryland were born outside the United States.
The vast majority of residents, roughly 99.1%, are U.S. citizens (including both native-born and naturalized citizens).