West Baton Rouge Parish, Louisiana Health Insurance Coverage (2024)
Detailed analysis of uninsured rates and coverage trends for West Baton Rouge Parish, Louisiana
Universe
27,279
Total Uninsured
1,287
Uninsured Rate
4.7%
Coverage by Age and Gender
Distribution of insured vs. uninsured residents in West Baton Rouge Parish, Louisiana
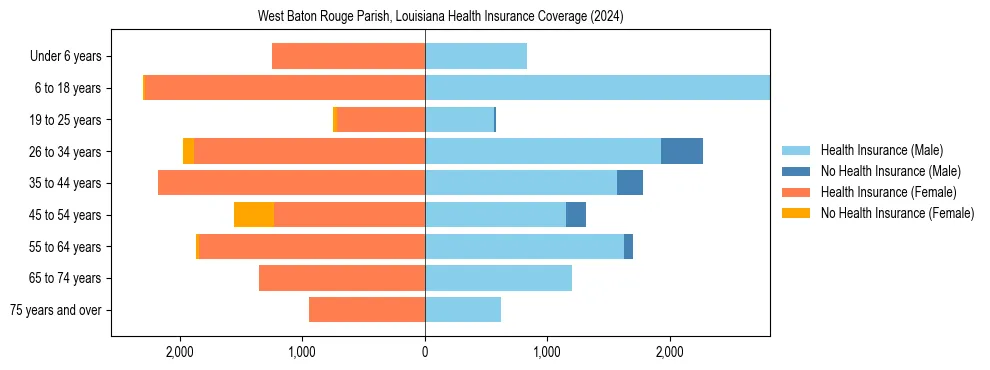
Uninsured Rates by Demographic Group
Under 18 Years
Male Uninsured0.0%
Female Uninsured0.6%
18 to 34 Years
Male Uninsured12.5%
Female Uninsured4.6%
35 to 64 Years
Male Uninsured9.0%
Female Uninsured6.2%
65 Years & Over
Male Uninsured0.0%
Female Uninsured0.0%
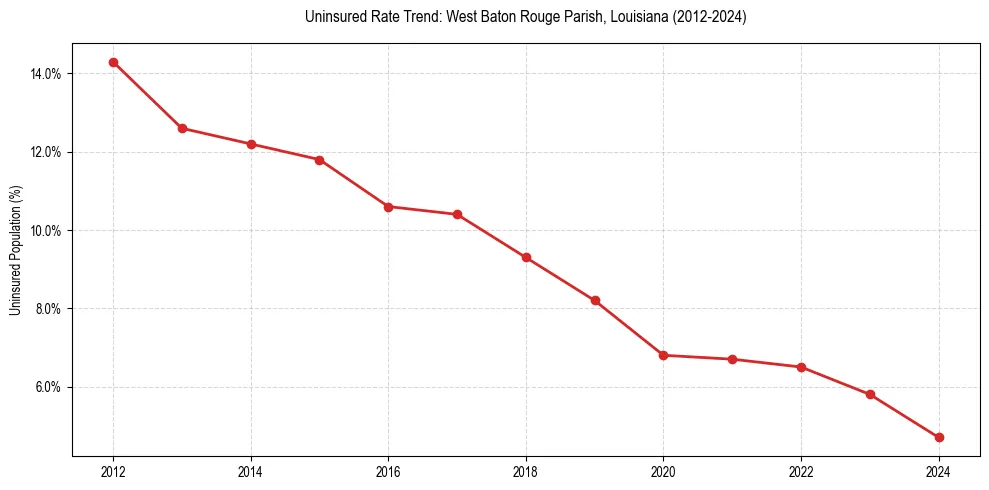
Uninsured Rate Trends
Historical coverage data from 2012 to 2024
| Year | Total Uninsured | Uninsured Rate |
|---|---|---|
| 2024 | 1,287 | 4.7% |
| 2023 | 1,556 | 5.8% |
| 2022 | 1,735 | 6.5% |
| 2021 | 1,758 | 6.7% |
| 2020 | 1,737 | 6.8% |
| 2019 | 2,074 | 8.2% |
| 2018 | 2,335 | 9.3% |
| 2017 | 2,563 | 10.4% |
| 2016 | 2,574 | 10.6% |
| 2015 | 2,838 | 11.8% |
| 2014 | 2,890 | 12.2% |
| 2013 | 2,936 | 12.6% |
| 2012 | 3,307 | 14.3% |
Frequently Asked Questions
Approximately 4.7% of the population in West Baton Rouge Parish, Louisiana does not have health insurance coverage.
In West Baton Rouge Parish, Louisiana, young adult males (18-34) face the highest barrier to coverage, with an uninsured rate of 12.5%. This is notably higher than the overall local average of 4.7%.