Vermilion Parish, Louisiana Nativity & Citizenship Status (2024)
Place of birth and citizenship status analysis for Vermilion Parish, Louisiana
Vermilion Parish, Louisiana Nativity & Citizenship Indicators (2024)
Native Born
97.0%
Foreign Born
3.0%
Naturalized
1.3%
US Citizens
98.3%
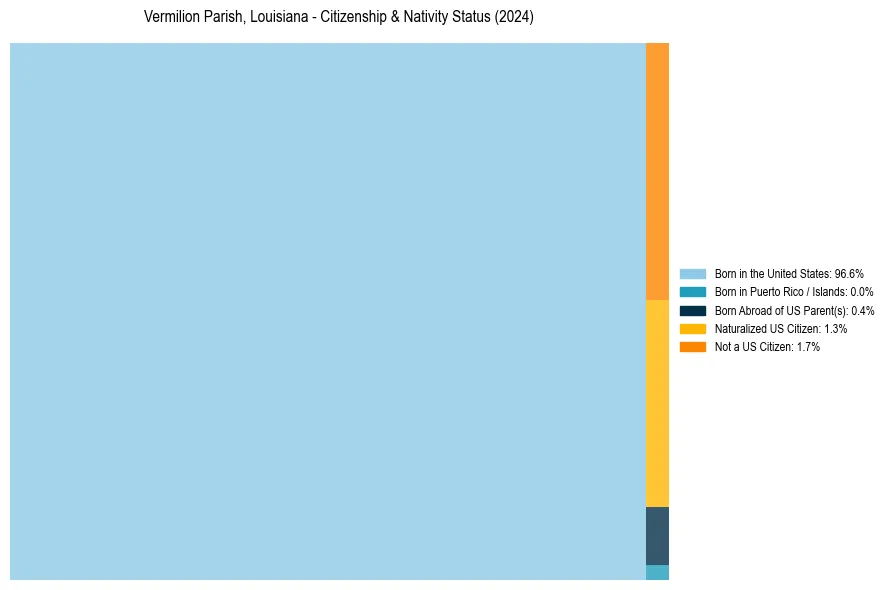
Vermilion Parish, Louisiana Nativity & Citizenship Distribution
Vermilion Parish, Louisiana Historical Nativity Trends (2010–2024)
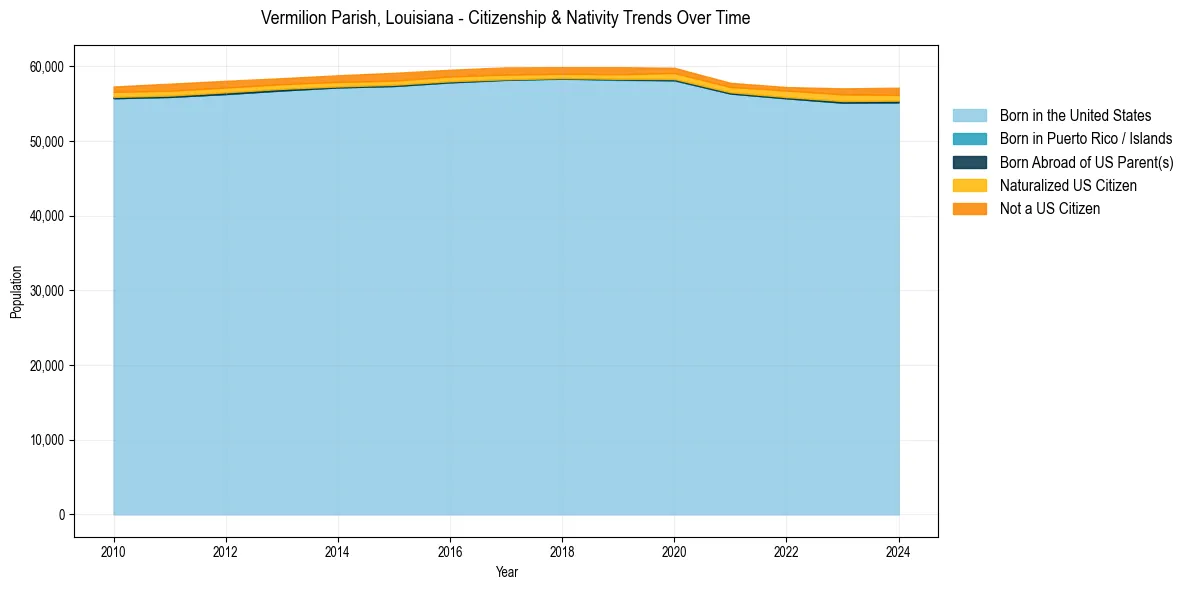
Vermilion Parish, Louisiana Population & Nativity History
| Year | Total Pop | Foreign Born | Native Born |
|---|---|---|---|
| 2024 | 57,123 | 3.0% | 97.0% |
| 2023 | 57,031 | 3.0% | 97.0% |
| 2022 | 57,202 | 2.3% | 97.7% |
| 2021 | 57,775 | 2.2% | 97.8% |
| 2020 | 59,787 | 2.5% | 97.5% |
| 2019 | 59,865 | 2.6% | 97.4% |
| 2018 | 59,867 | 2.4% | 97.6% |
| 2017 | 59,841 | 2.7% | 97.3% |
| 2016 | 59,524 | 2.6% | 97.4% |
| 2015 | 59,110 | 2.7% | 97.3% |
| 2014 | 58,784 | 2.5% | 97.5% |
| 2013 | 58,394 | 2.4% | 97.6% |
| 2012 | 58,041 | 2.7% | 97.3% |
| 2011 | 57,660 | 2.8% | 97.2% |
| 2010 | 57,280 | 2.4% | 97.6% |
Nativity & Citizenship FAQs for Vermilion Parish, Louisiana
Approximately 3.0% of residents in Vermilion Parish, Louisiana were born outside the United States.
The vast majority of residents, roughly 98.3%, are U.S. citizens (including both native-born and naturalized citizens).