Terrebonne Parish, Louisiana Nativity & Citizenship Status (2024)
Place of birth and citizenship status analysis for Terrebonne Parish, Louisiana
Terrebonne Parish, Louisiana Nativity & Citizenship Indicators (2024)
Native Born
96.8%
Foreign Born
3.2%
Naturalized
1.0%
US Citizens
97.7%
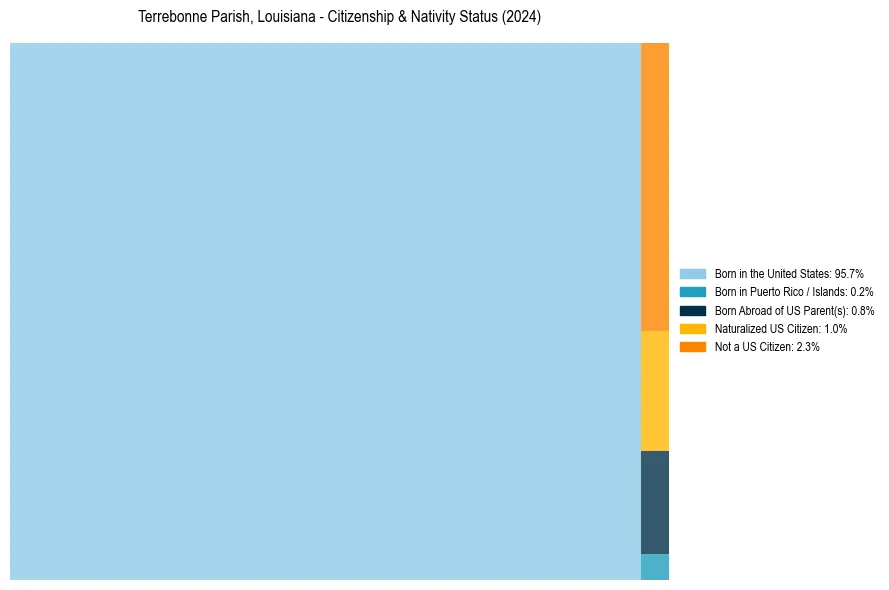
Terrebonne Parish, Louisiana Nativity & Citizenship Distribution
Terrebonne Parish, Louisiana Historical Nativity Trends (2010–2024)
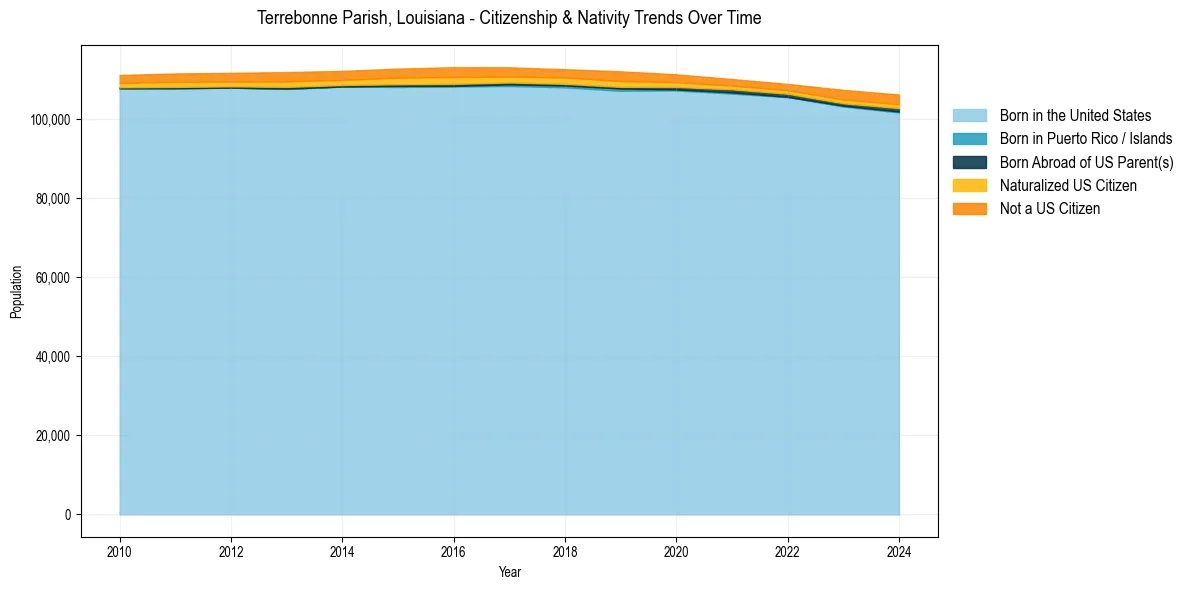
Terrebonne Parish, Louisiana Population & Nativity History
| Year | Total Pop | Foreign Born | Native Born |
|---|---|---|---|
| 2024 | 106,186 | 3.2% | 96.8% |
| 2023 | 107,362 | 3.2% | 96.8% |
| 2022 | 108,862 | 2.3% | 97.7% |
| 2021 | 110,100 | 2.4% | 97.6% |
| 2020 | 111,297 | 2.9% | 97.1% |
| 2019 | 112,054 | 3.5% | 96.5% |
| 2018 | 112,587 | 3.3% | 96.7% |
| 2017 | 113,067 | 3.4% | 96.6% |
| 2016 | 113,099 | 3.7% | 96.3% |
| 2015 | 112,742 | 3.5% | 96.5% |
| 2014 | 112,167 | 3.2% | 96.8% |
| 2013 | 111,868 | 3.4% | 96.6% |
| 2012 | 111,666 | 3.1% | 96.9% |
| 2011 | 111,518 | 3.1% | 96.9% |
| 2010 | 111,131 | 2.8% | 97.2% |
Nativity & Citizenship FAQs for Terrebonne Parish, Louisiana
Approximately 3.2% of residents in Terrebonne Parish, Louisiana were born outside the United States.
The vast majority of residents, roughly 97.7%, are U.S. citizens (including both native-born and naturalized citizens).