St. Tammany Parish, Louisiana Nativity & Citizenship Status (2024)
Place of birth and citizenship status analysis for St. Tammany Parish, Louisiana
St. Tammany Parish, Louisiana Nativity & Citizenship Indicators (2024)
Native Born
95.5%
Foreign Born
4.5%
Naturalized
2.1%
US Citizens
97.6%
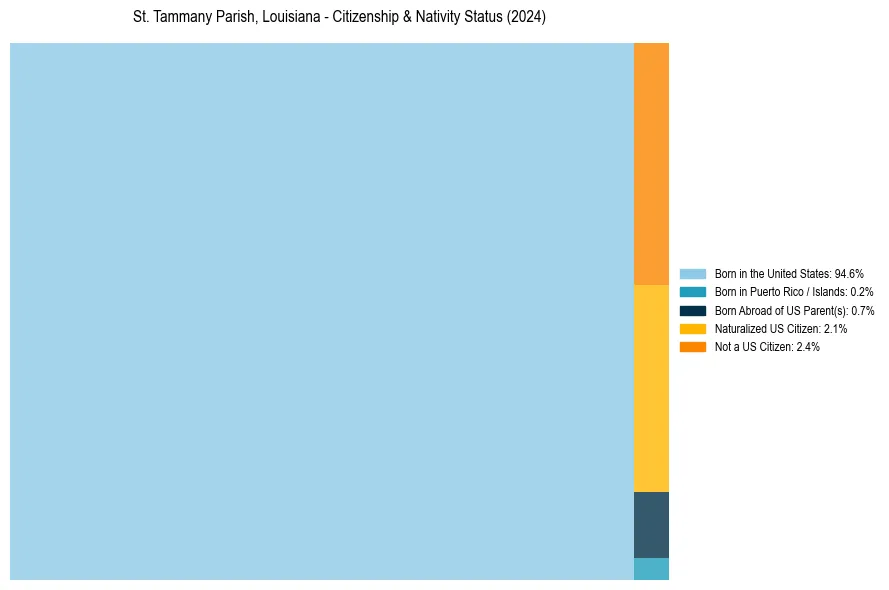
St. Tammany Parish, Louisiana Nativity & Citizenship Distribution
St. Tammany Parish, Louisiana Historical Nativity Trends (2010–2024)
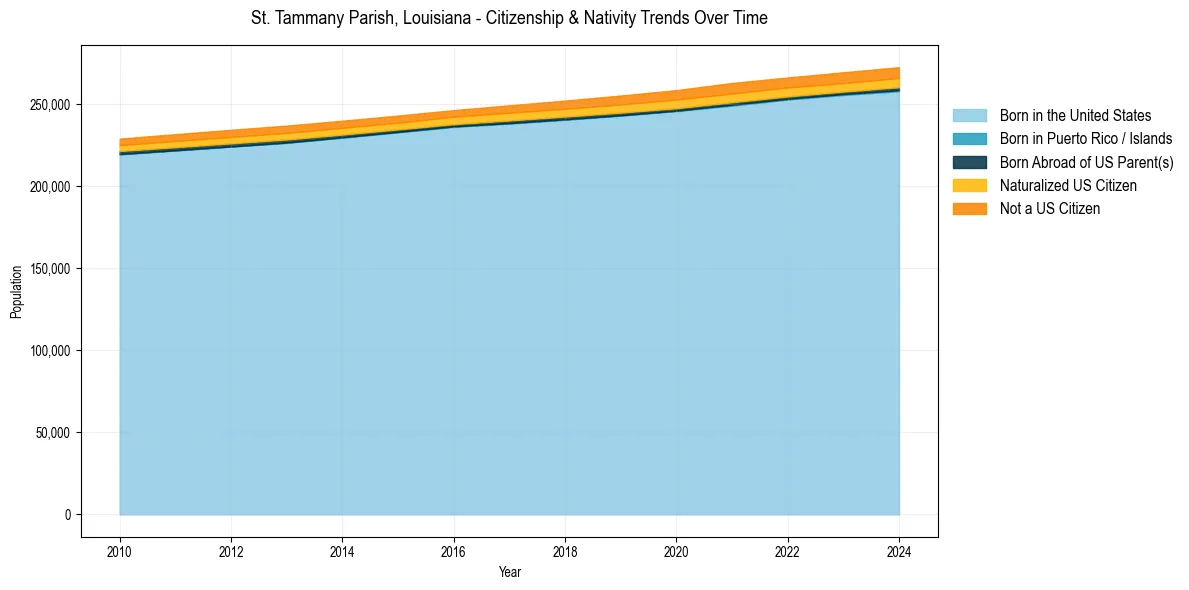
St. Tammany Parish, Louisiana Population & Nativity History
| Year | Total Pop | Foreign Born | Native Born |
|---|---|---|---|
| 2024 | 272,421 | 4.5% | 95.5% |
| 2023 | 269,331 | 4.4% | 95.6% |
| 2022 | 266,168 | 4.3% | 95.7% |
| 2021 | 262,799 | 4.5% | 95.5% |
| 2020 | 258,447 | 4.3% | 95.7% |
| 2019 | 255,155 | 4.1% | 95.9% |
| 2018 | 252,093 | 3.9% | 96.1% |
| 2017 | 249,201 | 3.7% | 96.3% |
| 2016 | 246,269 | 3.5% | 96.5% |
| 2015 | 242,960 | 3.5% | 96.5% |
| 2014 | 239,814 | 3.5% | 96.5% |
| 2013 | 236,832 | 3.6% | 96.4% |
| 2012 | 234,283 | 3.5% | 96.5% |
| 2011 | 231,629 | 3.4% | 96.6% |
| 2010 | 228,894 | 3.3% | 96.7% |
Nativity & Citizenship FAQs for St. Tammany Parish, Louisiana
Approximately 4.5% of residents in St. Tammany Parish, Louisiana were born outside the United States.
The vast majority of residents, roughly 97.6%, are U.S. citizens (including both native-born and naturalized citizens).