St. Landry Parish, Louisiana Nativity & Citizenship Status (2024)
Place of birth and citizenship status analysis for St. Landry Parish, Louisiana
St. Landry Parish, Louisiana Nativity & Citizenship Indicators (2024)
Native Born
98.4%
Foreign Born
1.6%
Naturalized
0.7%
US Citizens
99.0%
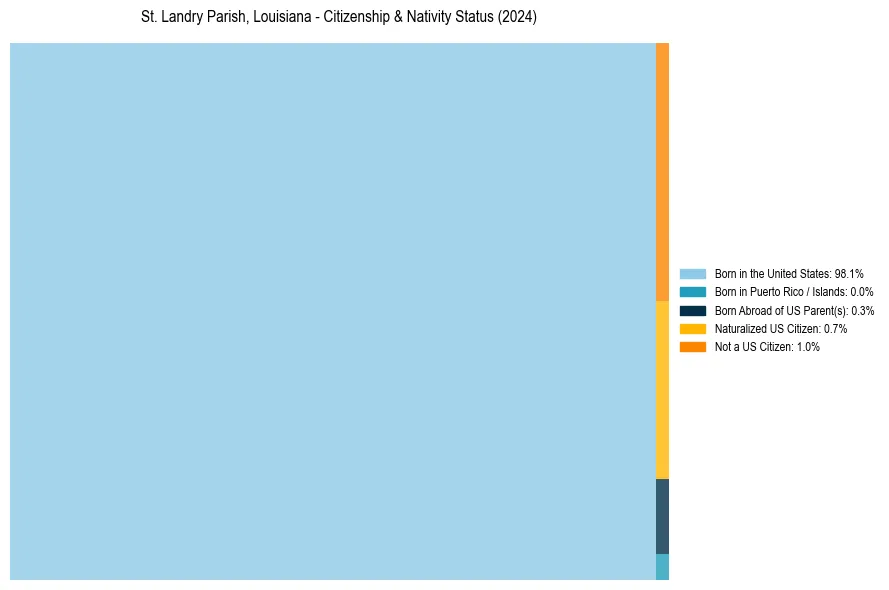
St. Landry Parish, Louisiana Nativity & Citizenship Distribution
St. Landry Parish, Louisiana Historical Nativity Trends (2010–2024)
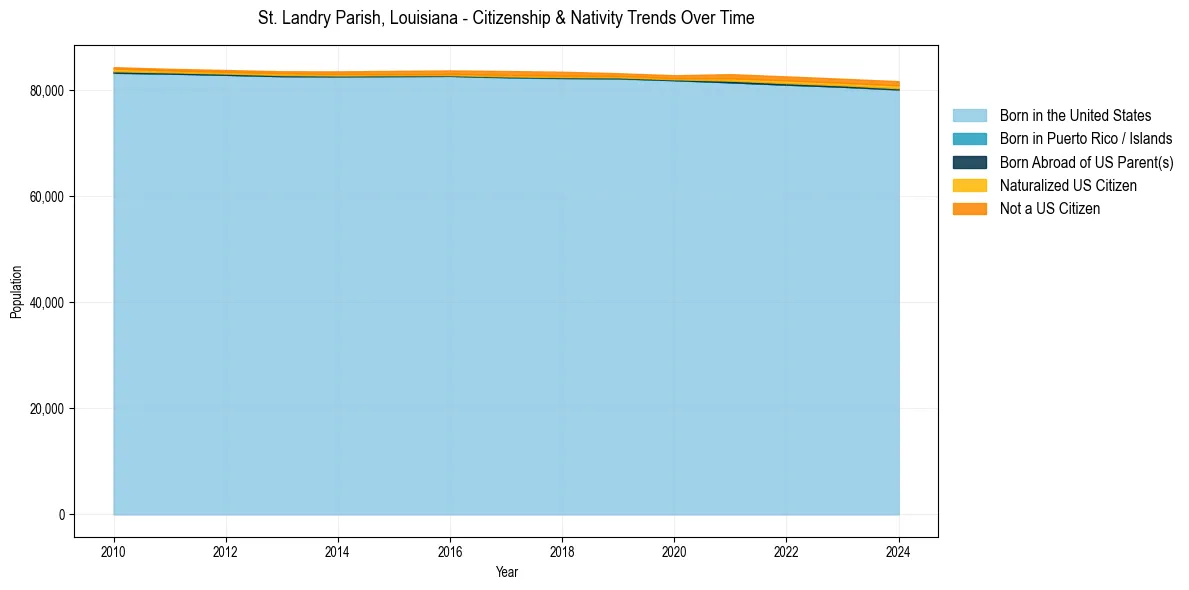
St. Landry Parish, Louisiana Population & Nativity History
| Year | Total Pop | Foreign Born | Native Born |
|---|---|---|---|
| 2024 | 81,670 | 1.6% | 98.4% |
| 2023 | 82,128 | 1.5% | 98.5% |
| 2022 | 82,574 | 1.5% | 98.5% |
| 2021 | 82,999 | 1.5% | 98.5% |
| 2020 | 82,786 | 0.9% | 99.1% |
| 2019 | 83,172 | 0.9% | 99.1% |
| 2018 | 83,449 | 1.2% | 98.8% |
| 2017 | 83,580 | 1.2% | 98.8% |
| 2016 | 83,699 | 1.1% | 98.9% |
| 2015 | 83,613 | 1.0% | 99.0% |
| 2014 | 83,518 | 0.9% | 99.1% |
| 2013 | 83,534 | 0.8% | 99.2% |
| 2012 | 83,774 | 0.8% | 99.2% |
| 2011 | 84,003 | 0.8% | 99.2% |
| 2010 | 84,309 | 0.9% | 99.1% |
Nativity & Citizenship FAQs for St. Landry Parish, Louisiana
Approximately 1.6% of residents in St. Landry Parish, Louisiana were born outside the United States.
The vast majority of residents, roughly 99.0%, are U.S. citizens (including both native-born and naturalized citizens).