Rapides Parish, Louisiana Nativity & Citizenship Status (2024)
Place of birth and citizenship status analysis for Rapides Parish, Louisiana
Rapides Parish, Louisiana Nativity & Citizenship Indicators (2024)
Native Born
97.2%
Foreign Born
2.8%
Naturalized
1.1%
US Citizens
98.3%
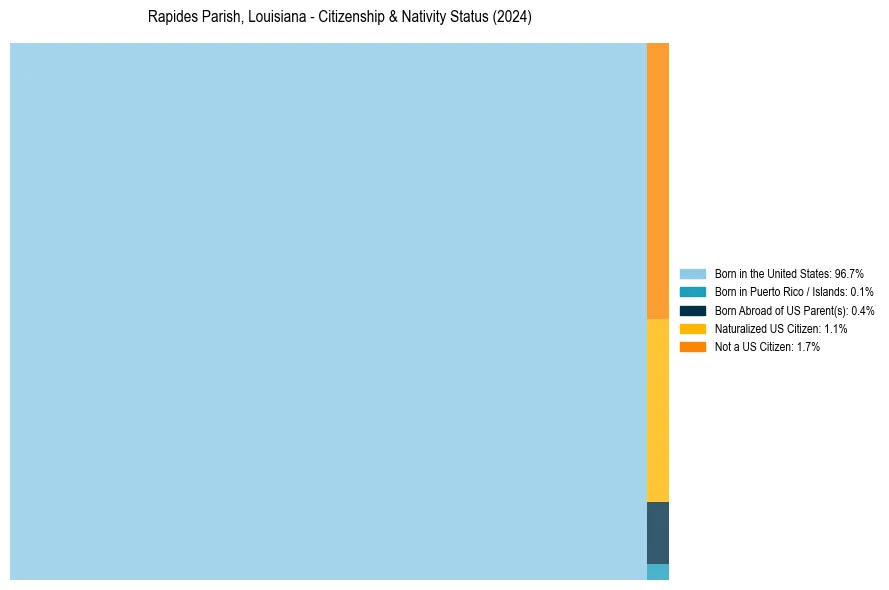
Rapides Parish, Louisiana Nativity & Citizenship Distribution
Rapides Parish, Louisiana Historical Nativity Trends (2010–2024)
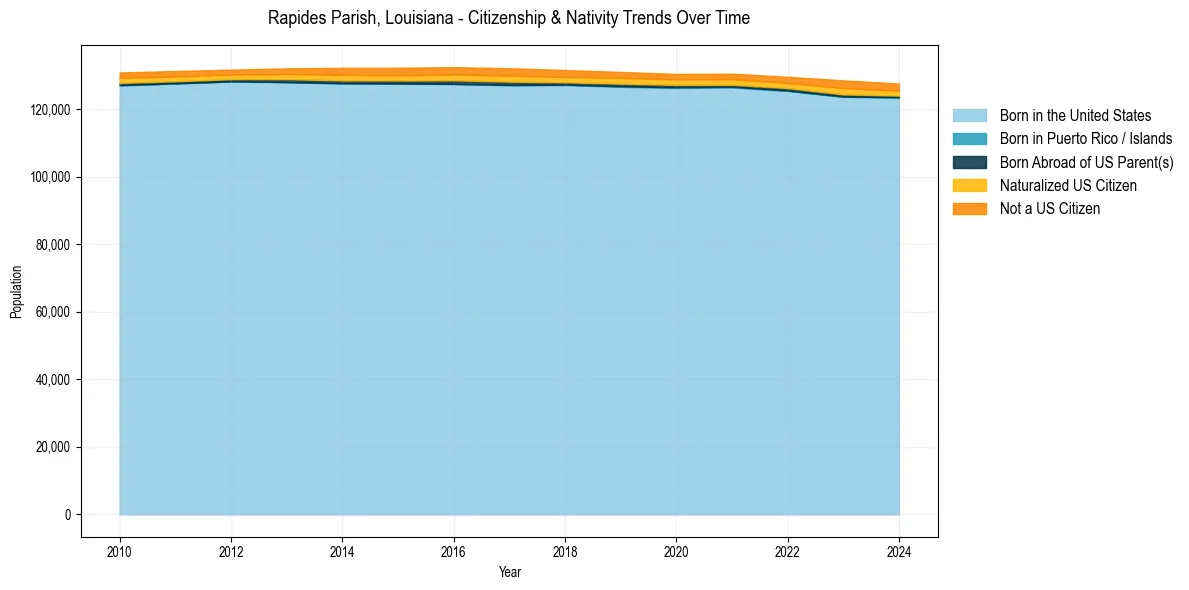
Rapides Parish, Louisiana Population & Nativity History
| Year | Total Pop | Foreign Born | Native Born |
|---|---|---|---|
| 2024 | 127,527 | 2.8% | 97.2% |
| 2023 | 128,470 | 3.2% | 96.8% |
| 2022 | 129,536 | 2.6% | 97.4% |
| 2021 | 130,459 | 2.5% | 97.5% |
| 2020 | 130,376 | 2.5% | 97.5% |
| 2019 | 130,970 | 2.7% | 97.3% |
| 2018 | 131,546 | 2.8% | 97.2% |
| 2017 | 132,080 | 3.0% | 97.0% |
| 2016 | 132,373 | 2.9% | 97.1% |
| 2015 | 132,225 | 2.9% | 97.1% |
| 2014 | 132,199 | 2.8% | 97.2% |
| 2013 | 132,034 | 2.4% | 97.6% |
| 2012 | 131,655 | 2.1% | 97.9% |
| 2011 | 131,254 | 2.3% | 97.7% |
| 2010 | 130,800 | 2.3% | 97.7% |
Nativity & Citizenship FAQs for Rapides Parish, Louisiana
Approximately 2.8% of residents in Rapides Parish, Louisiana were born outside the United States.
The vast majority of residents, roughly 98.3%, are U.S. citizens (including both native-born and naturalized citizens).