Ouachita Parish, Louisiana Nativity & Citizenship Status (2024)
Place of birth and citizenship status analysis for Ouachita Parish, Louisiana
Ouachita Parish, Louisiana Nativity & Citizenship Indicators (2024)
Native Born
97.8%
Foreign Born
2.2%
Naturalized
0.9%
US Citizens
98.7%
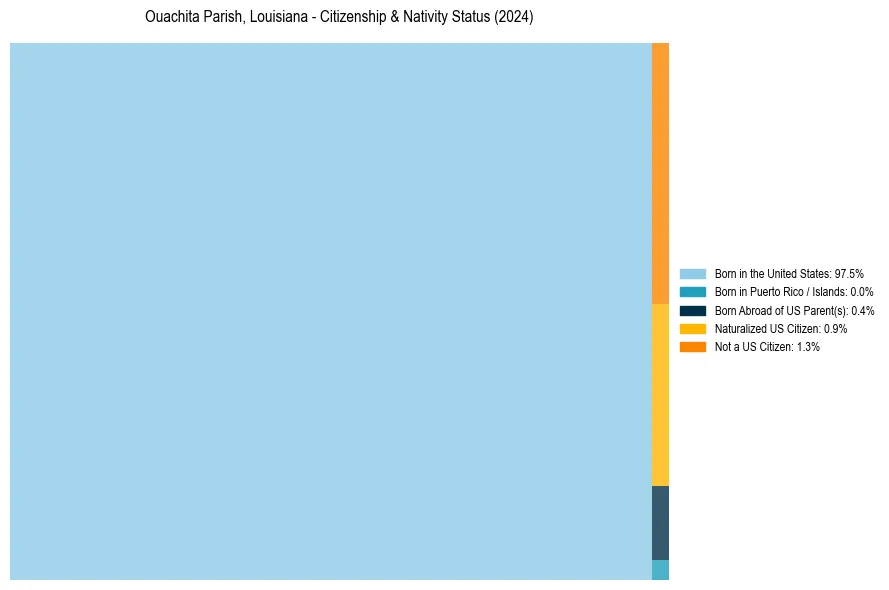
Ouachita Parish, Louisiana Nativity & Citizenship Distribution
Ouachita Parish, Louisiana Historical Nativity Trends (2010–2024)
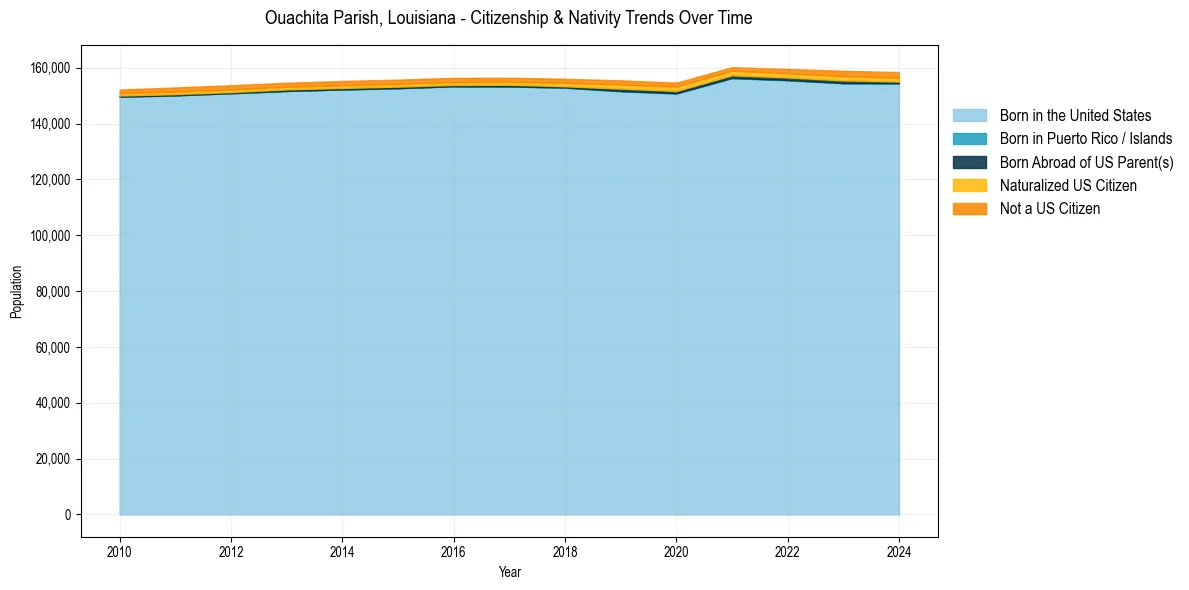
Ouachita Parish, Louisiana Population & Nativity History
| Year | Total Pop | Foreign Born | Native Born |
|---|---|---|---|
| 2024 | 158,480 | 2.2% | 97.8% |
| 2023 | 158,916 | 2.2% | 97.8% |
| 2022 | 159,585 | 1.9% | 98.1% |
| 2021 | 160,227 | 1.8% | 98.2% |
| 2020 | 154,679 | 1.9% | 98.1% |
| 2019 | 155,494 | 1.9% | 98.1% |
| 2018 | 156,075 | 1.7% | 98.3% |
| 2017 | 156,433 | 1.6% | 98.4% |
| 2016 | 156,398 | 1.6% | 98.4% |
| 2015 | 155,769 | 1.6% | 98.4% |
| 2014 | 155,285 | 1.6% | 98.4% |
| 2013 | 154,641 | 1.5% | 98.5% |
| 2012 | 153,752 | 1.6% | 98.4% |
| 2011 | 152,970 | 1.6% | 98.4% |
| 2010 | 152,207 | 1.4% | 98.6% |
Nativity & Citizenship FAQs for Ouachita Parish, Louisiana
Approximately 2.2% of residents in Ouachita Parish, Louisiana were born outside the United States.
The vast majority of residents, roughly 98.7%, are U.S. citizens (including both native-born and naturalized citizens).