Orleans Parish, Louisiana Nativity & Citizenship Status (2024)
Place of birth and citizenship status analysis for Orleans Parish, Louisiana
Orleans Parish, Louisiana Nativity & Citizenship Indicators (2024)
Native Born
93.4%
Foreign Born
6.6%
Naturalized
3.2%
US Citizens
96.6%
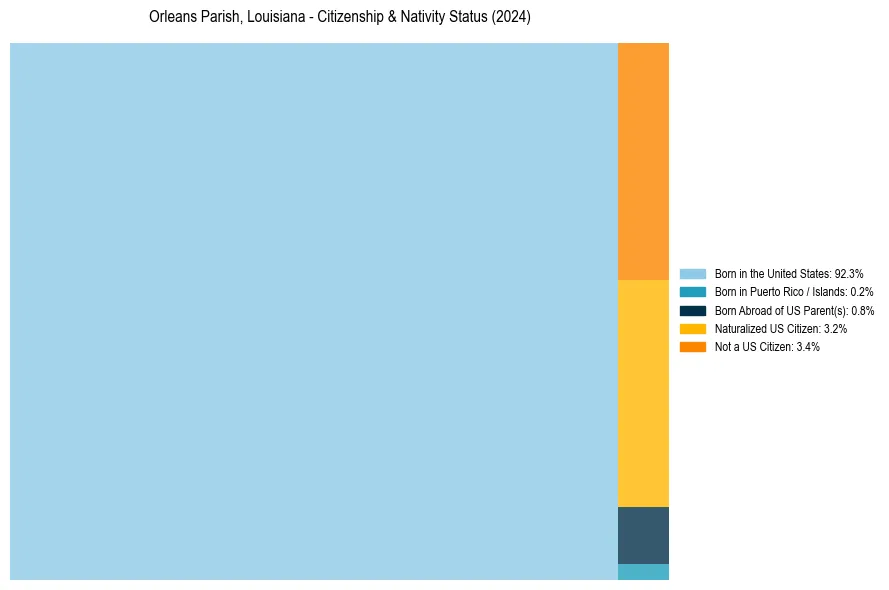
Orleans Parish, Louisiana Nativity & Citizenship Distribution
Orleans Parish, Louisiana Historical Nativity Trends (2010–2024)
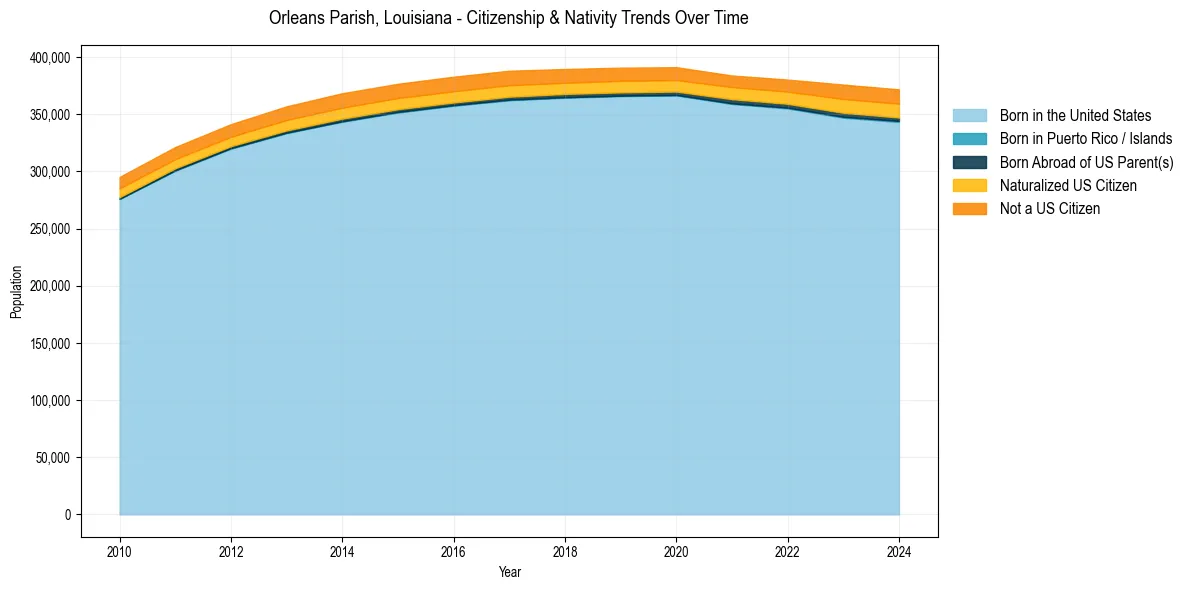
Orleans Parish, Louisiana Population & Nativity History
| Year | Total Pop | Foreign Born | Native Born |
|---|---|---|---|
| 2024 | 371,853 | 6.6% | 93.4% |
| 2023 | 376,035 | 6.6% | 93.4% |
| 2022 | 380,408 | 5.6% | 94.4% |
| 2021 | 383,974 | 5.4% | 94.6% |
| 2020 | 391,249 | 5.4% | 94.6% |
| 2019 | 390,845 | 5.5% | 94.5% |
| 2018 | 389,648 | 5.6% | 94.4% |
| 2017 | 388,182 | 5.9% | 94.1% |
| 2016 | 382,922 | 5.9% | 94.1% |
| 2015 | 376,738 | 5.9% | 94.1% |
| 2014 | 368,471 | 6.0% | 94.0% |
| 2013 | 357,013 | 5.9% | 94.1% |
| 2012 | 341,407 | 5.6% | 94.4% |
| 2011 | 321,409 | 5.8% | 94.2% |
| 2010 | 295,285 | 6.0% | 94.0% |
Nativity & Citizenship FAQs for Orleans Parish, Louisiana
Approximately 6.6% of residents in Orleans Parish, Louisiana were born outside the United States.
The vast majority of residents, roughly 96.6%, are U.S. citizens (including both native-born and naturalized citizens).