Livingston Parish, Louisiana Nativity & Citizenship Status (2024)
Place of birth and citizenship status analysis for Livingston Parish, Louisiana
Livingston Parish, Louisiana Nativity & Citizenship Indicators (2024)
Native Born
96.0%
Foreign Born
4.0%
Naturalized
0.9%
US Citizens
96.9%
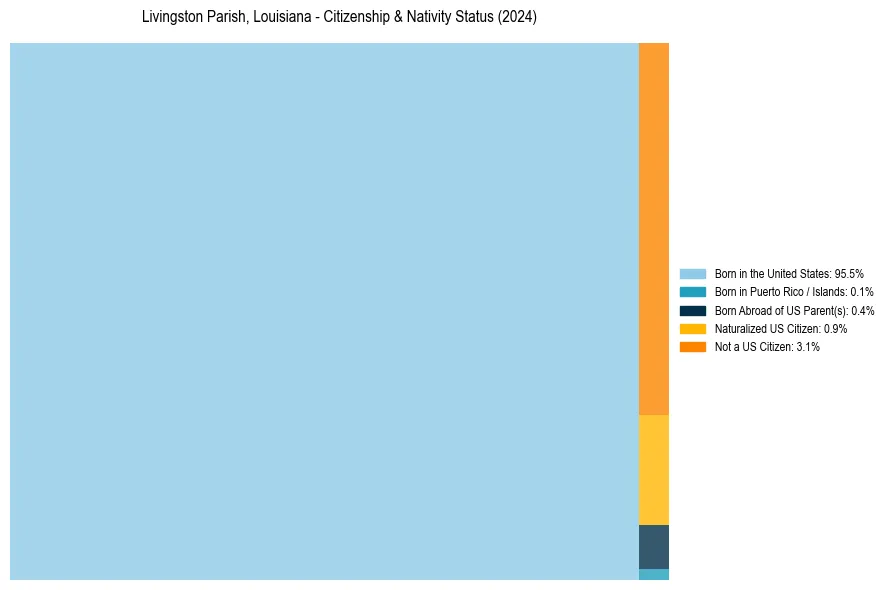
Livingston Parish, Louisiana Nativity & Citizenship Distribution
Livingston Parish, Louisiana Historical Nativity Trends (2010–2024)
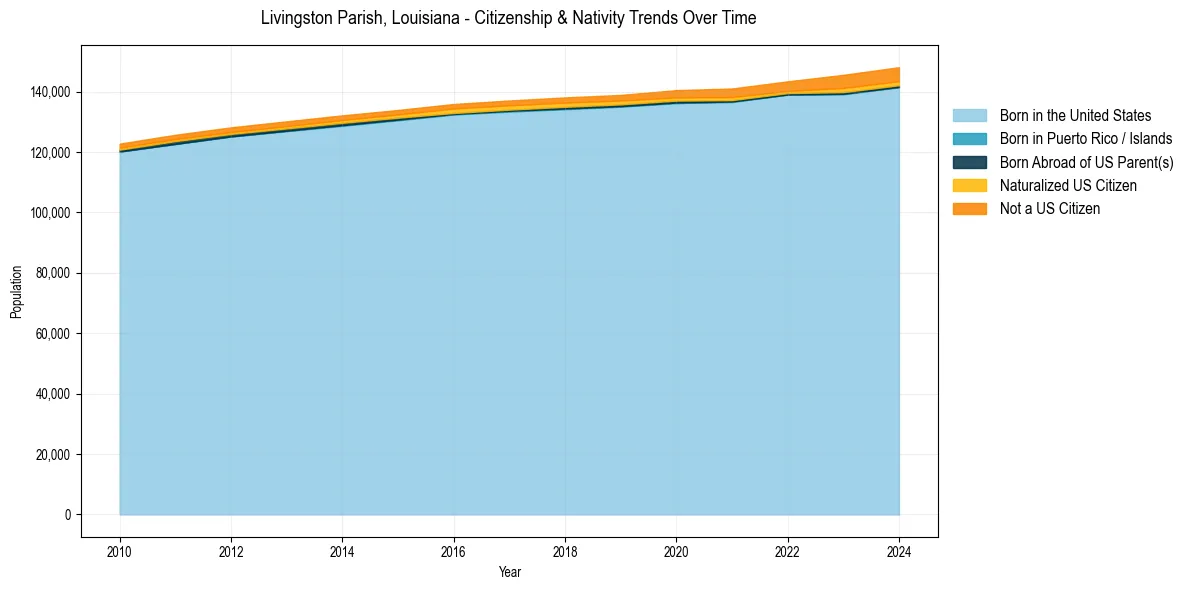
Livingston Parish, Louisiana Population & Nativity History
| Year | Total Pop | Foreign Born | Native Born |
|---|---|---|---|
| 2024 | 148,115 | 4.0% | 96.0% |
| 2023 | 145,583 | 3.9% | 96.1% |
| 2022 | 143,425 | 2.7% | 97.3% |
| 2021 | 141,057 | 2.7% | 97.3% |
| 2020 | 140,524 | 2.5% | 97.5% |
| 2019 | 138,928 | 2.2% | 97.8% |
| 2018 | 138,111 | 2.3% | 97.7% |
| 2017 | 137,096 | 2.2% | 97.8% |
| 2016 | 135,925 | 2.2% | 97.8% |
| 2015 | 133,949 | 1.9% | 98.1% |
| 2014 | 132,160 | 1.9% | 98.1% |
| 2013 | 130,192 | 1.8% | 98.2% |
| 2012 | 128,192 | 1.7% | 98.3% |
| 2011 | 125,732 | 1.7% | 98.3% |
| 2010 | 122,798 | 1.6% | 98.4% |
Nativity & Citizenship FAQs for Livingston Parish, Louisiana
Approximately 4.0% of residents in Livingston Parish, Louisiana were born outside the United States.
The vast majority of residents, roughly 96.9%, are U.S. citizens (including both native-born and naturalized citizens).