Lincoln Parish, Louisiana Nativity & Citizenship Status (2024)
Place of birth and citizenship status analysis for Lincoln Parish, Louisiana
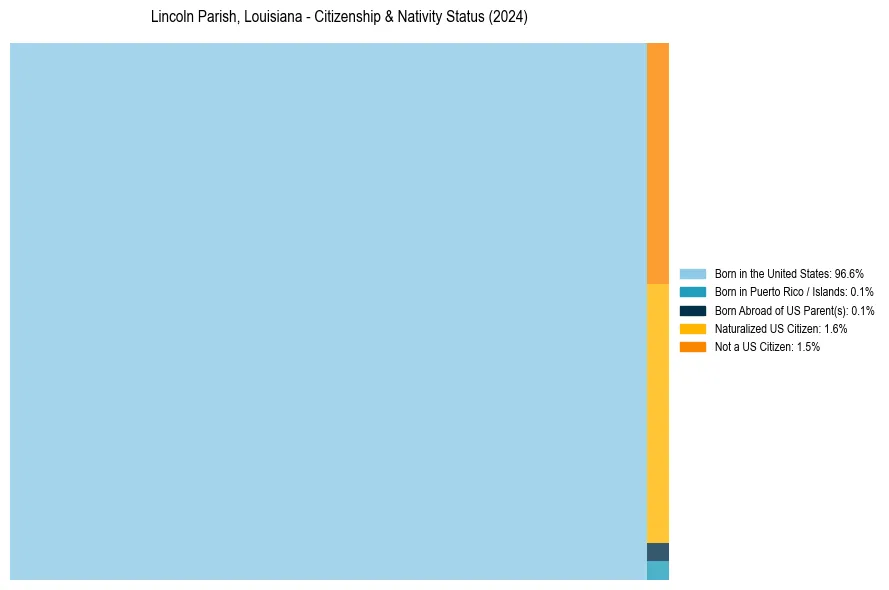
Lincoln Parish, Louisiana Nativity & Citizenship Indicators (2024)
Native Born
96.8%
Foreign Born
3.2%
Naturalized
1.6%
US Citizens
98.5%
Lincoln Parish, Louisiana Nativity & Citizenship Distribution
Lincoln Parish, Louisiana Historical Nativity Trends (2010–2024)
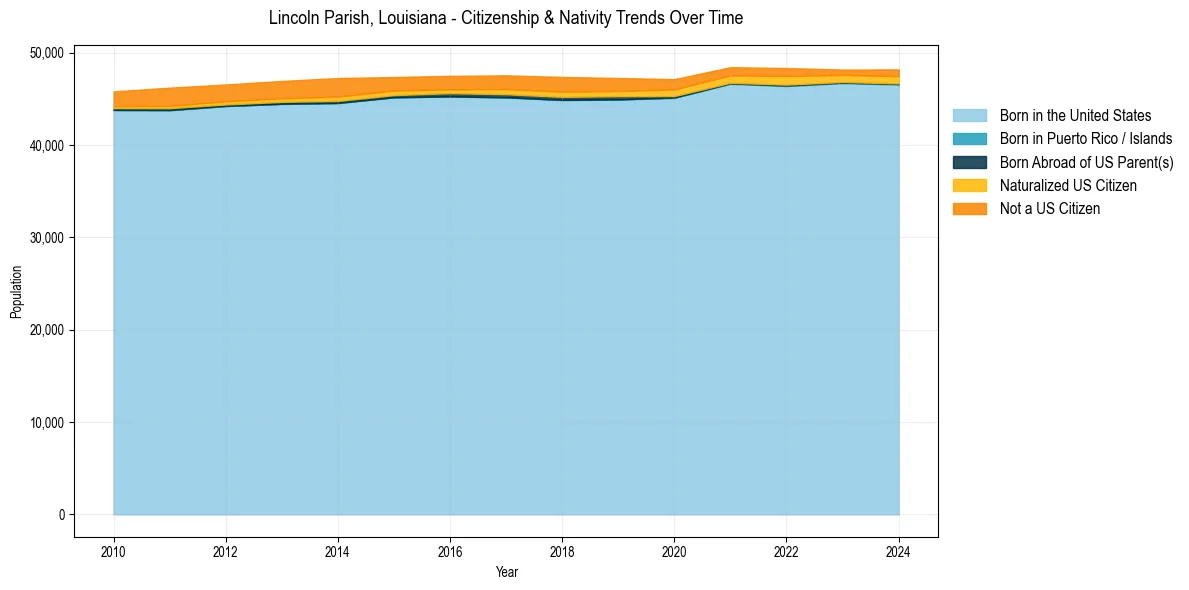
Lincoln Parish, Louisiana Population & Nativity History
| Year | Total Pop | Foreign Born | Native Born |
|---|---|---|---|
| 2024 | 48,174 | 3.2% | 96.8% |
| 2023 | 48,160 | 2.8% | 97.2% |
| 2022 | 48,323 | 3.7% | 96.3% |
| 2021 | 48,415 | 3.5% | 96.5% |
| 2020 | 47,118 | 3.9% | 96.1% |
| 2019 | 47,246 | 4.2% | 95.8% |
| 2018 | 47,356 | 4.6% | 95.4% |
| 2017 | 47,536 | 4.3% | 95.7% |
| 2016 | 47,480 | 4.0% | 96.0% |
| 2015 | 47,349 | 4.1% | 95.9% |
| 2014 | 47,243 | 5.3% | 94.7% |
| 2013 | 46,926 | 4.8% | 95.2% |
| 2012 | 46,543 | 4.6% | 95.4% |
| 2011 | 46,198 | 4.8% | 95.2% |
| 2010 | 45,797 | 4.0% | 96.0% |
Nativity & Citizenship FAQs for Lincoln Parish, Louisiana
Approximately 3.2% of residents in Lincoln Parish, Louisiana were born outside the United States.
The vast majority of residents, roughly 98.5%, are U.S. citizens (including both native-born and naturalized citizens).