Jefferson Parish, Louisiana Nativity & Citizenship Status (2024)
Place of birth and citizenship status analysis for Jefferson Parish, Louisiana
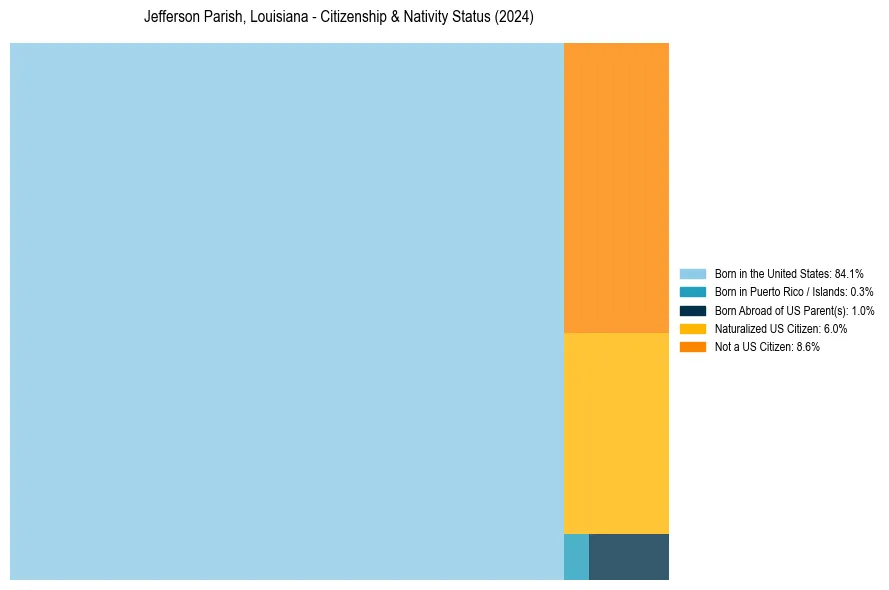
Jefferson Parish, Louisiana Nativity & Citizenship Indicators (2024)
Native Born
85.4%
Foreign Born
14.6%
Naturalized
6.0%
US Citizens
91.4%
Jefferson Parish, Louisiana Nativity & Citizenship Distribution
Jefferson Parish, Louisiana Historical Nativity Trends (2010–2024)
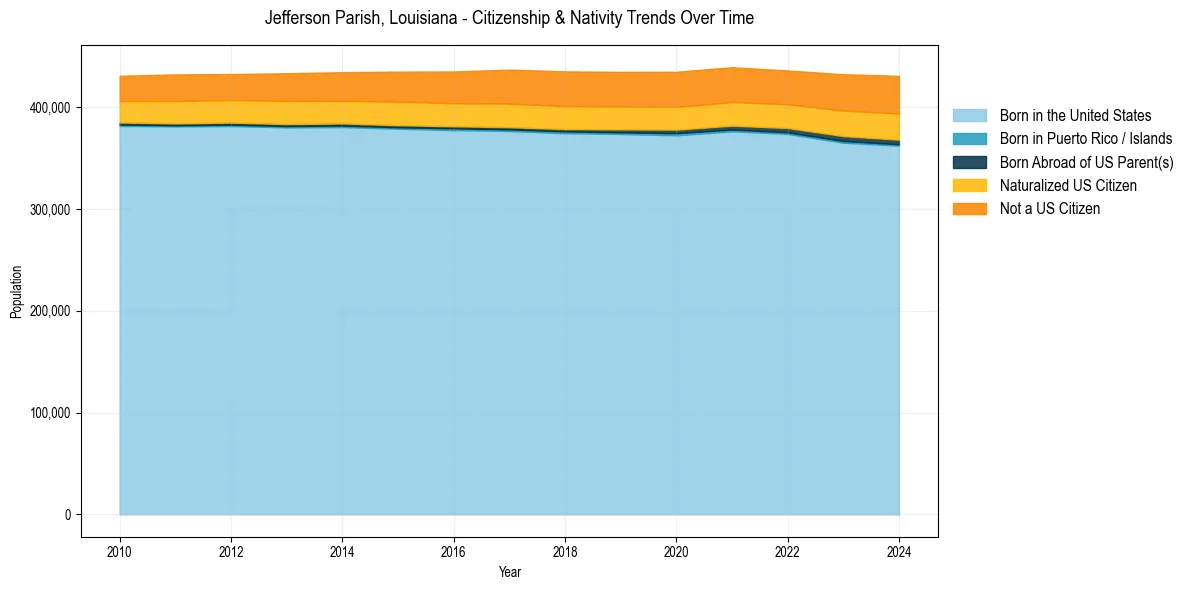
Jefferson Parish, Louisiana Population & Nativity History
| Year | Total Pop | Foreign Born | Native Born |
|---|---|---|---|
| 2024 | 430,920 | 14.6% | 85.4% |
| 2023 | 432,484 | 14.1% | 85.9% |
| 2022 | 436,171 | 13.0% | 87.0% |
| 2021 | 439,402 | 13.1% | 86.9% |
| 2020 | 434,903 | 13.1% | 86.9% |
| 2019 | 434,850 | 13.0% | 87.0% |
| 2018 | 435,300 | 13.0% | 87.0% |
| 2017 | 437,038 | 12.9% | 87.1% |
| 2016 | 435,204 | 12.4% | 87.6% |
| 2015 | 435,092 | 12.1% | 87.9% |
| 2014 | 434,528 | 11.6% | 88.4% |
| 2013 | 433,477 | 11.5% | 88.5% |
| 2012 | 432,706 | 11.0% | 89.0% |
| 2011 | 432,310 | 11.1% | 88.9% |
| 2010 | 431,019 | 10.7% | 89.3% |
Nativity & Citizenship FAQs for Jefferson Parish, Louisiana
Approximately 14.6% of residents in Jefferson Parish, Louisiana were born outside the United States.
The vast majority of residents, roughly 91.4%, are U.S. citizens (including both native-born and naturalized citizens).