Iberia Parish, Louisiana Nativity & Citizenship Status (2024)
Place of birth and citizenship status analysis for Iberia Parish, Louisiana
Iberia Parish, Louisiana Nativity & Citizenship Indicators (2024)
Native Born
97.4%
Foreign Born
2.6%
Naturalized
1.6%
US Citizens
99.0%
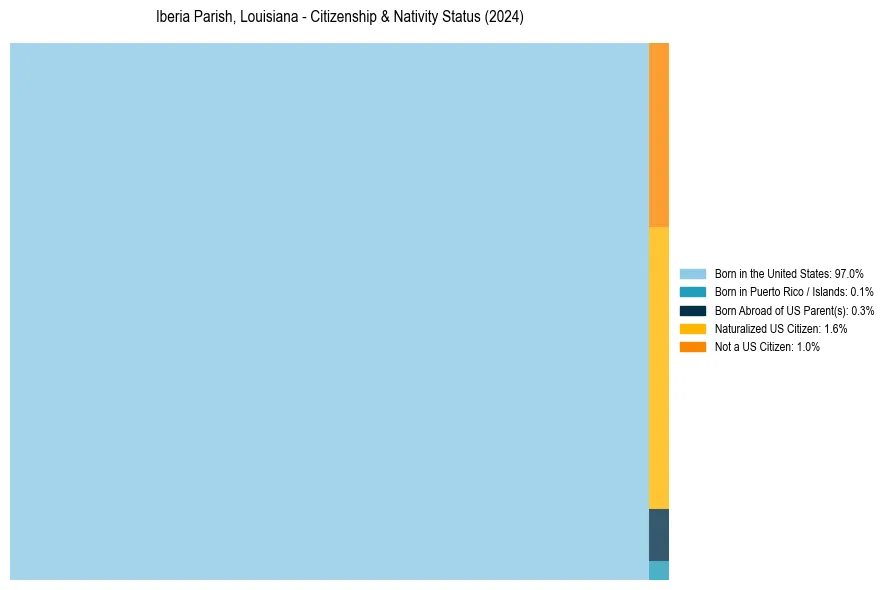
Iberia Parish, Louisiana Nativity & Citizenship Distribution
Iberia Parish, Louisiana Historical Nativity Trends (2010–2024)
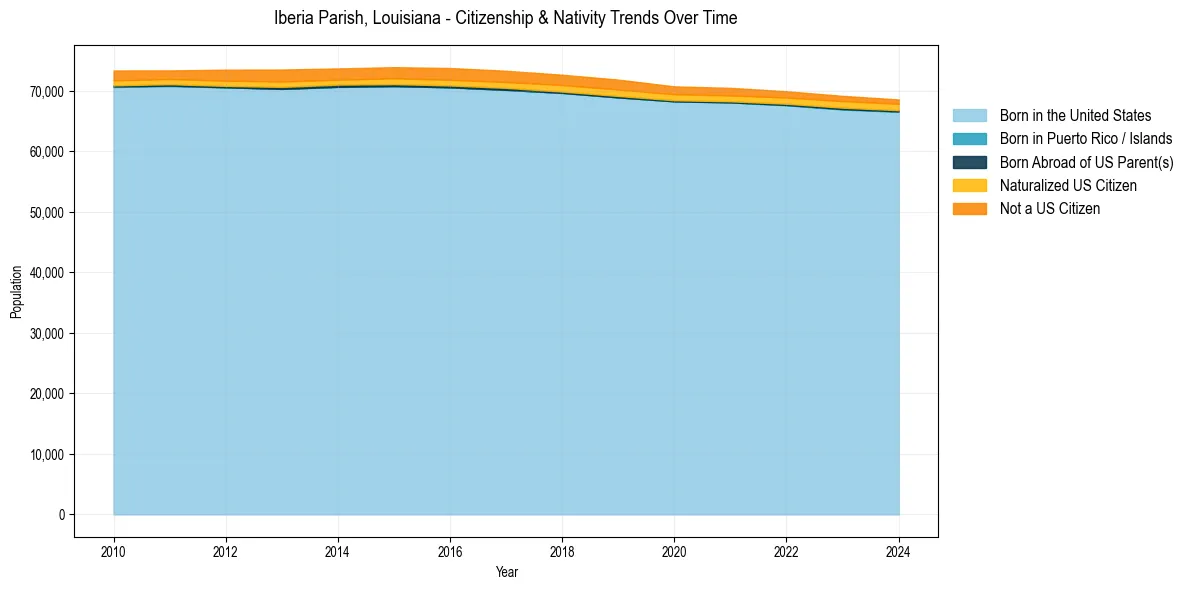
Iberia Parish, Louisiana Population & Nativity History
| Year | Total Pop | Foreign Born | Native Born |
|---|---|---|---|
| 2024 | 68,599 | 2.6% | 97.4% |
| 2023 | 69,194 | 2.8% | 97.2% |
| 2022 | 69,958 | 3.0% | 97.0% |
| 2021 | 70,518 | 3.1% | 96.9% |
| 2020 | 70,763 | 3.2% | 96.8% |
| 2019 | 71,887 | 3.8% | 96.2% |
| 2018 | 72,691 | 3.8% | 96.2% |
| 2017 | 73,346 | 3.9% | 96.1% |
| 2016 | 73,799 | 3.9% | 96.1% |
| 2015 | 73,938 | 3.8% | 96.2% |
| 2014 | 73,735 | 3.6% | 96.4% |
| 2013 | 73,551 | 3.9% | 96.1% |
| 2012 | 73,527 | 3.7% | 96.3% |
| 2011 | 73,407 | 3.1% | 96.9% |
| 2010 | 73,395 | 3.4% | 96.6% |
Nativity & Citizenship FAQs for Iberia Parish, Louisiana
Approximately 2.6% of residents in Iberia Parish, Louisiana were born outside the United States.
The vast majority of residents, roughly 99.0%, are U.S. citizens (including both native-born and naturalized citizens).