East Carroll Parish, Louisiana Nativity & Citizenship Status (2024)
Place of birth and citizenship status analysis for East Carroll Parish, Louisiana
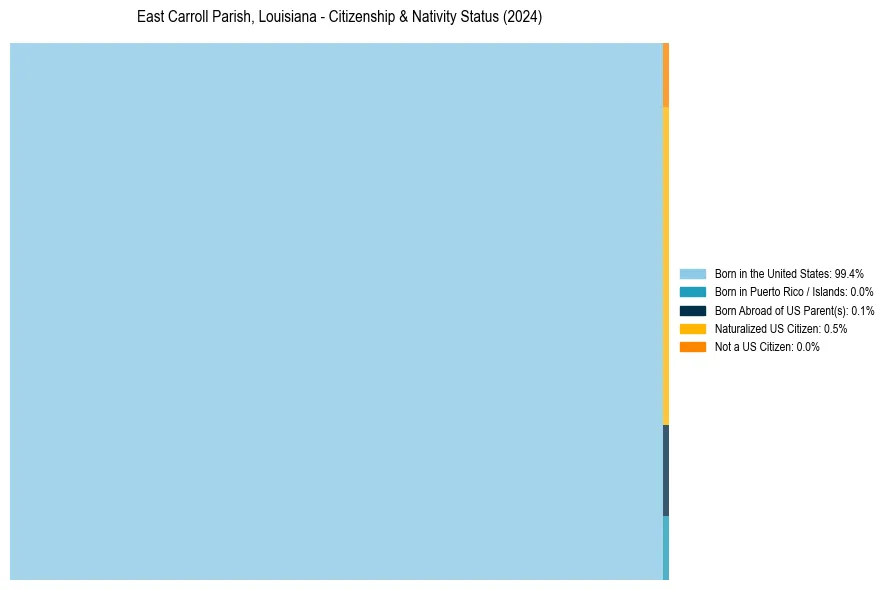
East Carroll Parish, Louisiana Nativity & Citizenship Indicators (2024)
Native Born
99.5%
Foreign Born
0.5%
Naturalized
0.5%
US Citizens
100.0%
East Carroll Parish, Louisiana Nativity & Citizenship Distribution
East Carroll Parish, Louisiana Historical Nativity Trends (2010–2024)
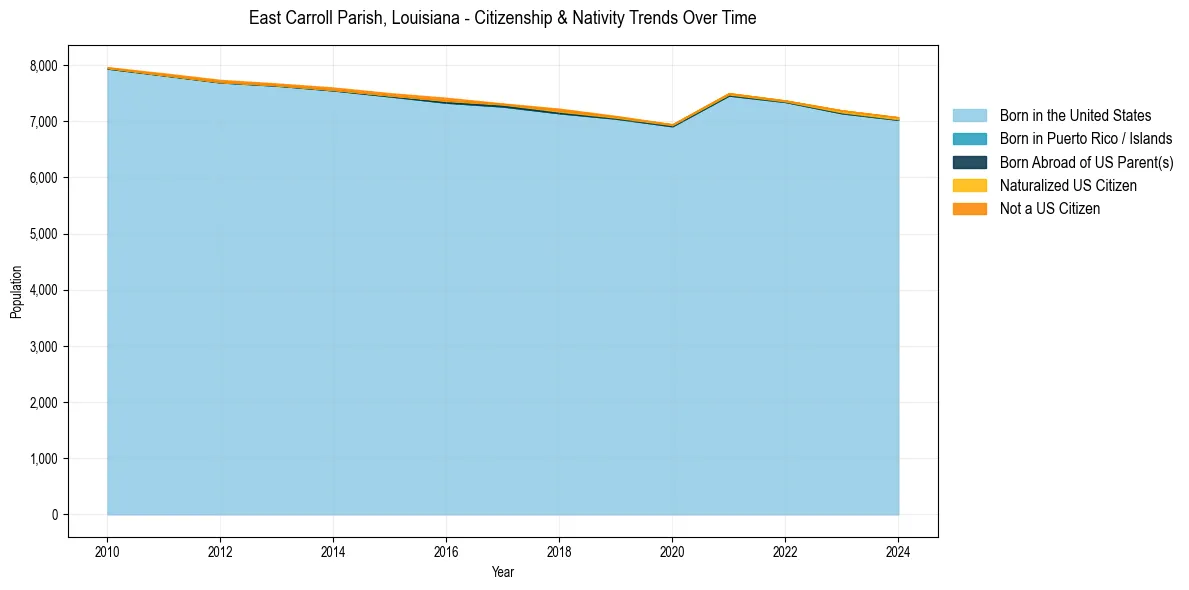
East Carroll Parish, Louisiana Population & Nativity History
| Year | Total Pop | Foreign Born | Native Born |
|---|---|---|---|
| 2024 | 7,072 | 0.5% | 99.5% |
| 2023 | 7,195 | 0.5% | 99.5% |
| 2022 | 7,371 | 0.2% | 99.8% |
| 2021 | 7,502 | 0.3% | 99.7% |
| 2020 | 6,947 | 0.2% | 99.8% |
| 2019 | 7,096 | 0.4% | 99.6% |
| 2018 | 7,225 | 0.7% | 99.3% |
| 2017 | 7,318 | 0.2% | 99.8% |
| 2016 | 7,419 | 0.8% | 99.2% |
| 2015 | 7,501 | 0.5% | 99.5% |
| 2014 | 7,602 | 0.5% | 99.5% |
| 2013 | 7,674 | 0.4% | 99.6% |
| 2012 | 7,738 | 0.5% | 99.5% |
| 2011 | 7,854 | 0.4% | 99.6% |
| 2010 | 7,964 | 0.2% | 99.8% |
Nativity & Citizenship FAQs for East Carroll Parish, Louisiana
Approximately 0.5% of residents in East Carroll Parish, Louisiana were born outside the United States.
The vast majority of residents, roughly 100.0%, are U.S. citizens (including both native-born and naturalized citizens).