East Baton Rouge Parish, Louisiana Nativity & Citizenship Status (2024)
Place of birth and citizenship status analysis for East Baton Rouge Parish, Louisiana
East Baton Rouge Parish, Louisiana Nativity & Citizenship Indicators (2024)
Native Born
92.9%
Foreign Born
7.1%
Naturalized
2.6%
US Citizens
95.5%
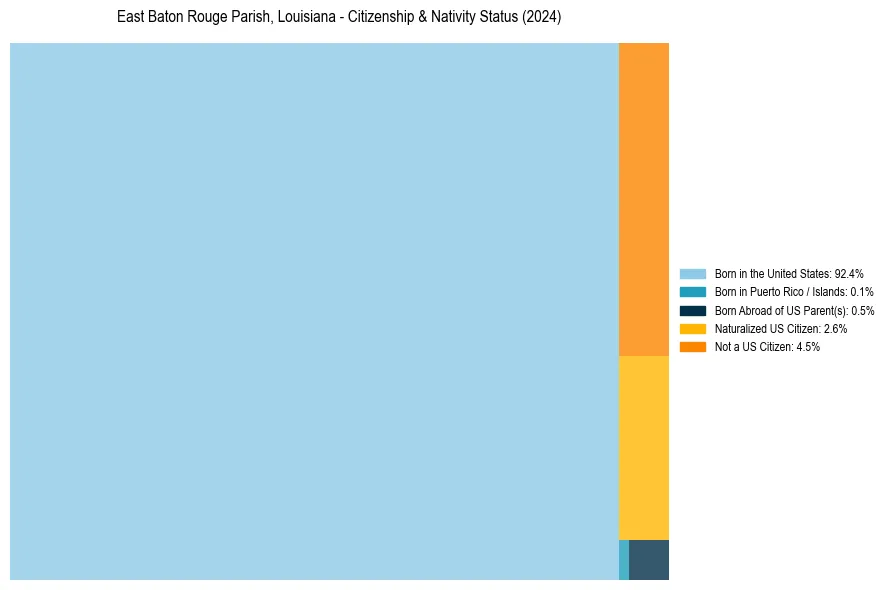
East Baton Rouge Parish, Louisiana Nativity & Citizenship Distribution
East Baton Rouge Parish, Louisiana Historical Nativity Trends (2010–2024)
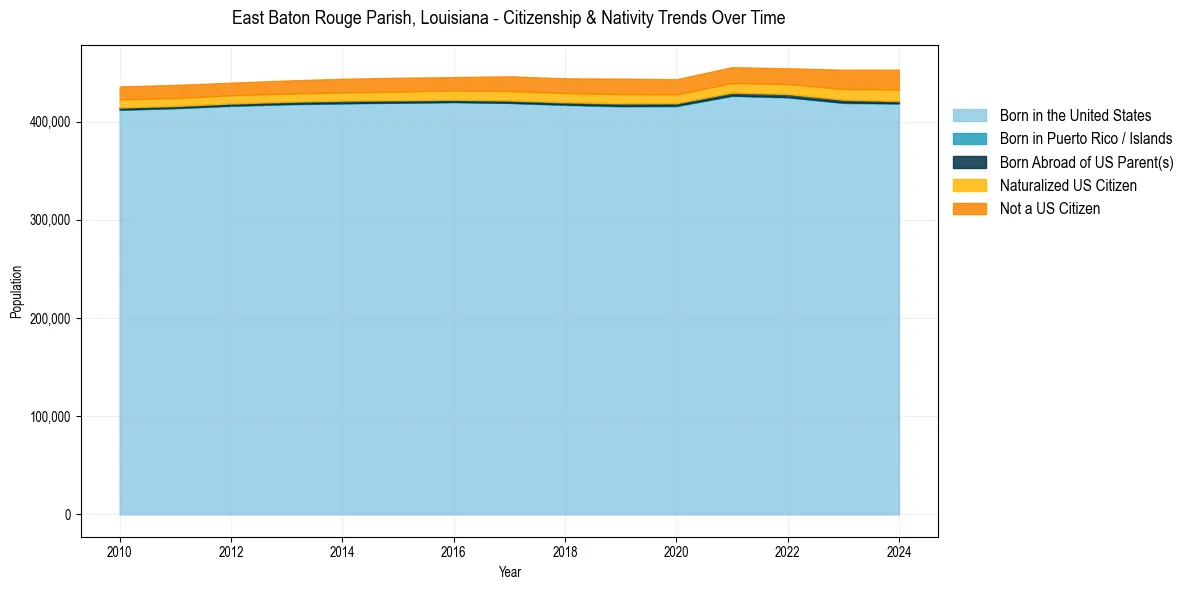
East Baton Rouge Parish, Louisiana Population & Nativity History
| Year | Total Pop | Foreign Born | Native Born |
|---|---|---|---|
| 2024 | 452,938 | 7.1% | 92.9% |
| 2023 | 452,821 | 6.7% | 93.3% |
| 2022 | 454,369 | 5.8% | 94.2% |
| 2021 | 455,447 | 5.7% | 94.3% |
| 2020 | 443,158 | 5.5% | 94.5% |
| 2019 | 443,763 | 5.7% | 94.3% |
| 2018 | 444,094 | 5.5% | 94.5% |
| 2017 | 446,167 | 5.5% | 94.5% |
| 2016 | 445,337 | 5.2% | 94.8% |
| 2015 | 444,690 | 5.2% | 94.8% |
| 2014 | 443,598 | 5.0% | 95.0% |
| 2013 | 441,901 | 4.9% | 95.1% |
| 2012 | 439,662 | 4.8% | 95.2% |
| 2011 | 437,401 | 4.9% | 95.1% |
| 2010 | 435,815 | 4.9% | 95.1% |
Nativity & Citizenship FAQs for East Baton Rouge Parish, Louisiana
Approximately 7.1% of residents in East Baton Rouge Parish, Louisiana were born outside the United States.
The vast majority of residents, roughly 95.5%, are U.S. citizens (including both native-born and naturalized citizens).