Bossier Parish, Louisiana Nativity & Citizenship Status (2024)
Place of birth and citizenship status analysis for Bossier Parish, Louisiana
Bossier Parish, Louisiana Nativity & Citizenship Indicators (2024)
Native Born
95.7%
Foreign Born
4.3%
Naturalized
1.9%
US Citizens
97.6%
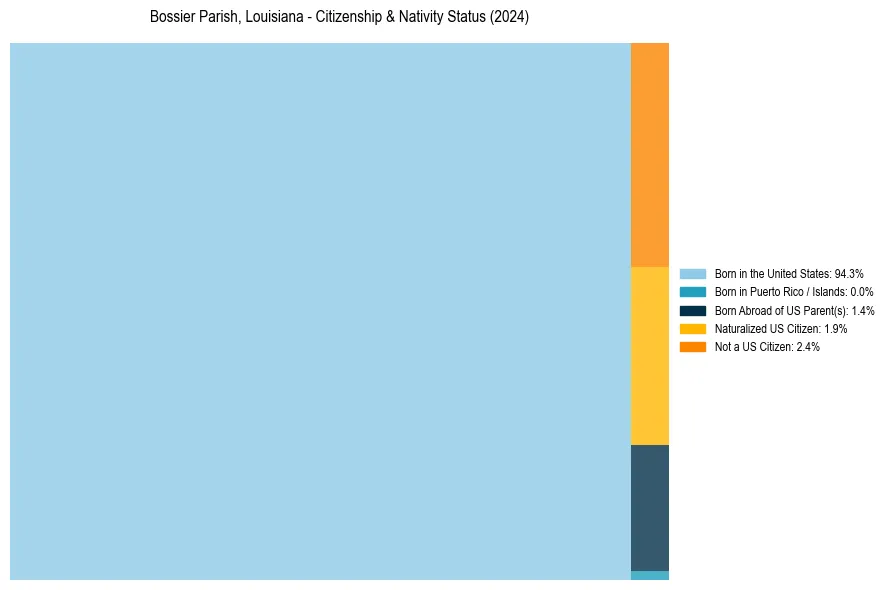
Bossier Parish, Louisiana Nativity & Citizenship Distribution
Bossier Parish, Louisiana Historical Nativity Trends (2010–2024)
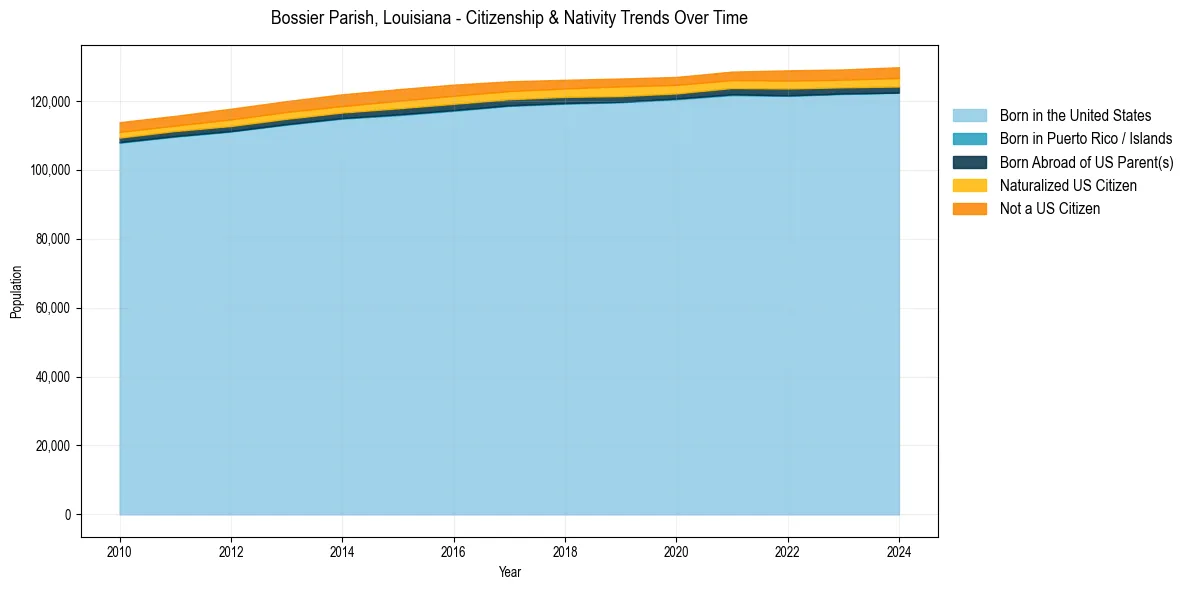
Bossier Parish, Louisiana Population & Nativity History
| Year | Total Pop | Foreign Born | Native Born |
|---|---|---|---|
| 2024 | 129,789 | 4.3% | 95.7% |
| 2023 | 129,134 | 4.0% | 96.0% |
| 2022 | 128,877 | 4.1% | 95.9% |
| 2021 | 128,508 | 3.7% | 96.3% |
| 2020 | 126,952 | 3.8% | 96.2% |
| 2019 | 126,499 | 4.0% | 96.0% |
| 2018 | 126,131 | 3.9% | 96.1% |
| 2017 | 125,698 | 4.1% | 95.9% |
| 2016 | 124,720 | 4.5% | 95.5% |
| 2015 | 123,403 | 4.5% | 95.5% |
| 2014 | 121,918 | 4.3% | 95.7% |
| 2013 | 119,947 | 4.3% | 95.7% |
| 2012 | 117,742 | 4.3% | 95.7% |
| 2011 | 115,667 | 3.8% | 96.2% |
| 2010 | 113,837 | 3.9% | 96.1% |
Nativity & Citizenship FAQs for Bossier Parish, Louisiana
Approximately 4.3% of residents in Bossier Parish, Louisiana were born outside the United States.
The vast majority of residents, roughly 97.6%, are U.S. citizens (including both native-born and naturalized citizens).