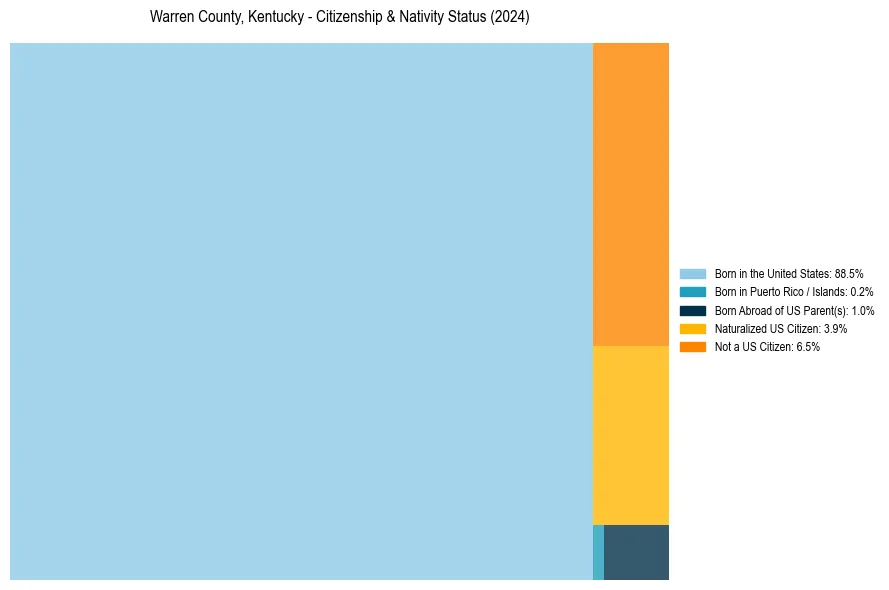
Warren County, Kentucky Nativity & Citizenship Status (2024)
Place of birth and citizenship status analysis for Warren County, Kentucky
Warren County, Kentucky Nativity & Citizenship Indicators (2024)
Native Born
89.6%
Foreign Born
10.4%
Naturalized
3.9%
US Citizens
93.5%
Warren County, Kentucky Nativity & Citizenship Distribution
Warren County, Kentucky Historical Nativity Trends (2010–2024)
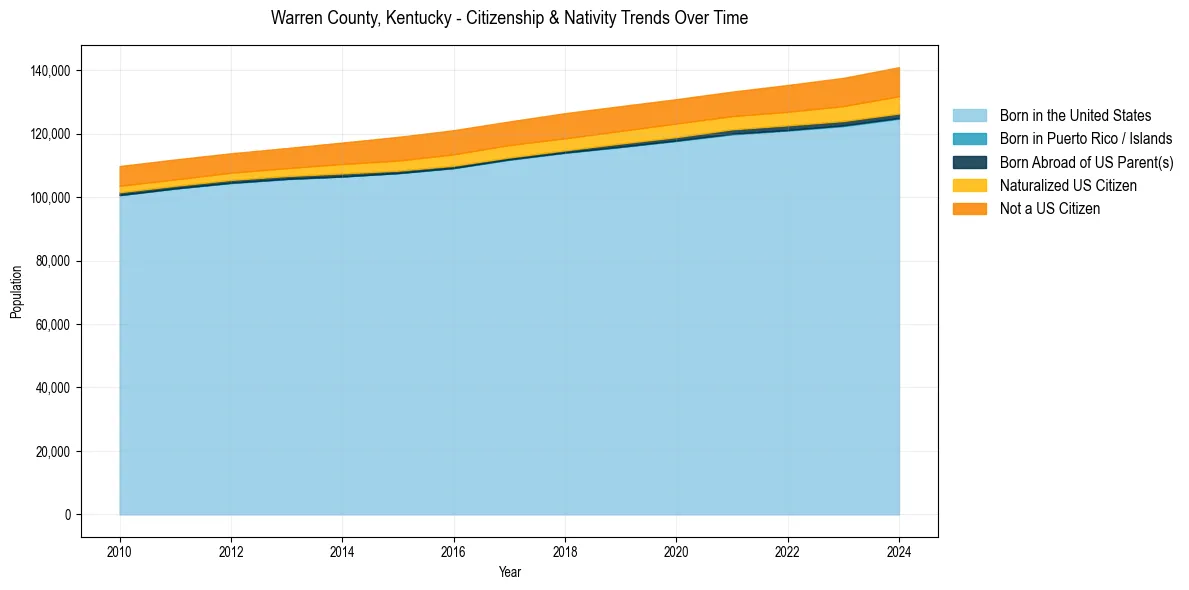
Warren County, Kentucky Population & Nativity History
| Year | Total Pop | Foreign Born | Native Born |
|---|---|---|---|
| 2024 | 140,918 | 10.4% | 89.6% |
| 2023 | 137,549 | 9.9% | 90.1% |
| 2022 | 135,307 | 9.4% | 90.6% |
| 2021 | 133,216 | 8.9% | 91.1% |
| 2020 | 130,836 | 9.1% | 90.9% |
| 2019 | 128,652 | 9.2% | 90.8% |
| 2018 | 126,427 | 9.3% | 90.7% |
| 2017 | 123,824 | 9.2% | 90.8% |
| 2016 | 121,066 | 9.3% | 90.7% |
| 2015 | 118,950 | 8.9% | 91.1% |
| 2014 | 117,169 | 8.3% | 91.7% |
| 2013 | 115,438 | 7.6% | 92.4% |
| 2012 | 113,787 | 7.4% | 92.6% |
| 2011 | 111,843 | 7.4% | 92.6% |
| 2010 | 109,775 | 7.5% | 92.5% |
Nativity & Citizenship FAQs for Warren County, Kentucky
Approximately 10.4% of residents in Warren County, Kentucky were born outside the United States.
The vast majority of residents, roughly 93.5%, are U.S. citizens (including both native-born and naturalized citizens).