Franklin County, Kentucky Nativity & Citizenship Status (2024)
Place of birth and citizenship status analysis for Franklin County, Kentucky
Franklin County, Kentucky Nativity & Citizenship Indicators (2024)
Native Born
96.0%
Foreign Born
4.0%
Naturalized
1.5%
US Citizens
97.5%
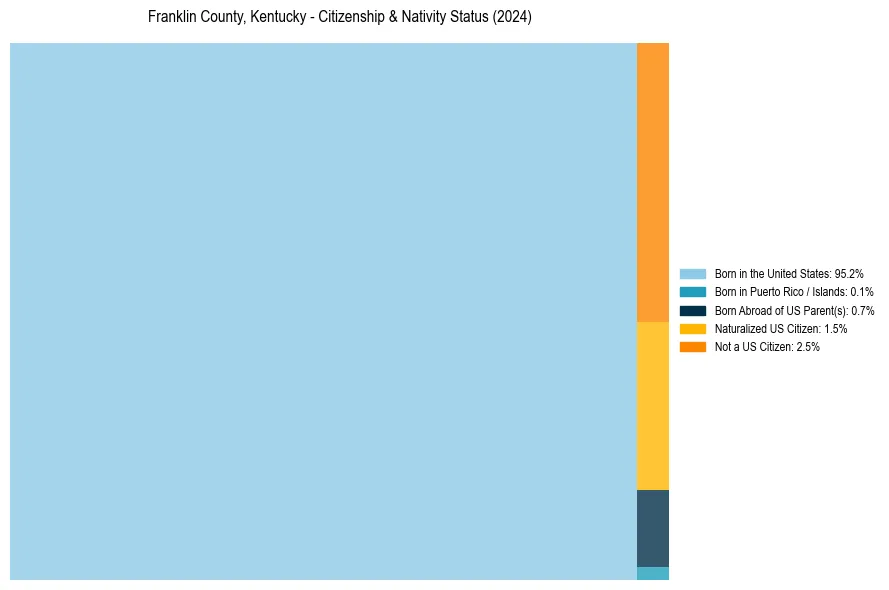
Franklin County, Kentucky Nativity & Citizenship Distribution
Franklin County, Kentucky Historical Nativity Trends (2010–2024)
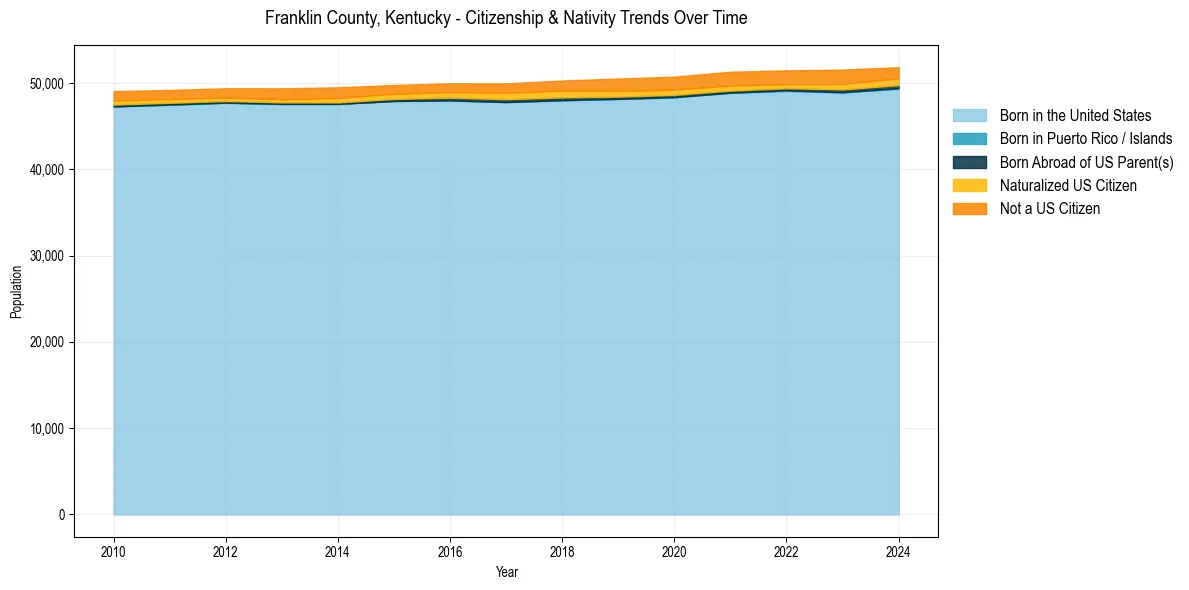
Franklin County, Kentucky Population & Nativity History
| Year | Total Pop | Foreign Born | Native Born |
|---|---|---|---|
| 2024 | 51,842 | 4.0% | 96.0% |
| 2023 | 51,563 | 4.5% | 95.5% |
| 2022 | 51,475 | 4.0% | 96.0% |
| 2021 | 51,319 | 4.3% | 95.7% |
| 2020 | 50,744 | 4.2% | 95.8% |
| 2019 | 50,529 | 4.2% | 95.8% |
| 2018 | 50,296 | 3.9% | 96.1% |
| 2017 | 49,969 | 3.7% | 96.3% |
| 2016 | 49,982 | 3.3% | 96.7% |
| 2015 | 49,778 | 3.3% | 96.7% |
| 2014 | 49,509 | 3.5% | 96.5% |
| 2013 | 49,390 | 3.3% | 96.7% |
| 2012 | 49,399 | 3.0% | 97.0% |
| 2011 | 49,205 | 3.0% | 97.0% |
| 2010 | 49,067 | 3.2% | 96.8% |
Nativity & Citizenship FAQs for Franklin County, Kentucky
Approximately 4.0% of residents in Franklin County, Kentucky were born outside the United States.
The vast majority of residents, roughly 97.5%, are U.S. citizens (including both native-born and naturalized citizens).