Wyandotte County, Kansas Nativity & Citizenship Status (2024)
Place of birth and citizenship status analysis for Wyandotte County, Kansas
Wyandotte County, Kansas Nativity & Citizenship Indicators (2024)
Native Born
82.1%
Foreign Born
17.9%
Naturalized
5.8%
US Citizens
87.8%
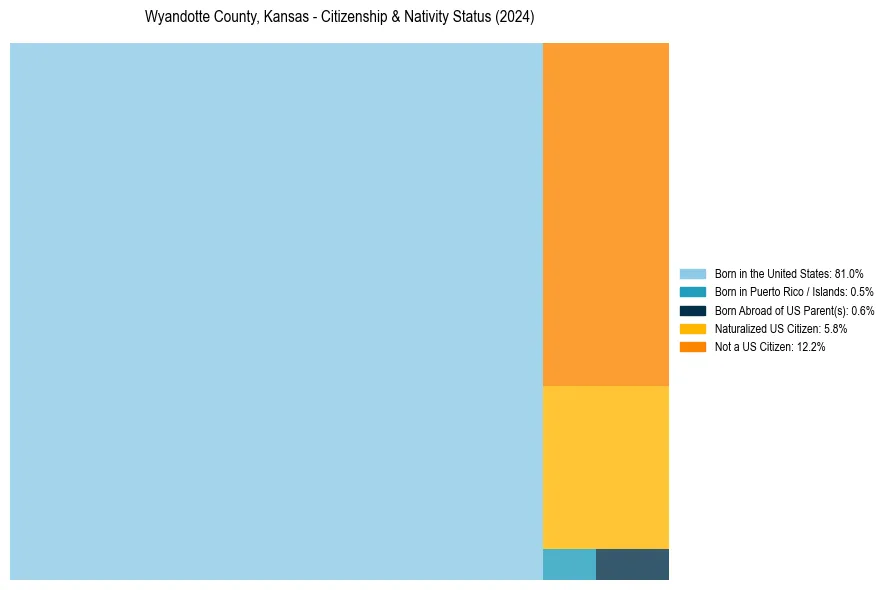
Wyandotte County, Kansas Nativity & Citizenship Distribution
Wyandotte County, Kansas Historical Nativity Trends (2010–2024)
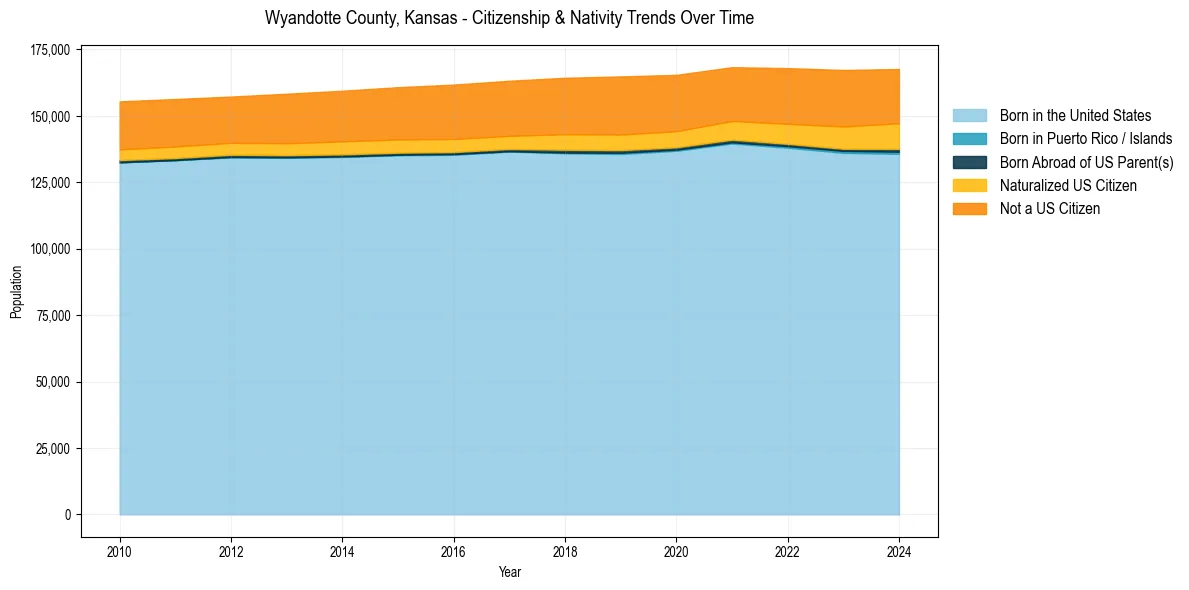
Wyandotte County, Kansas Population & Nativity History
| Year | Total Pop | Foreign Born | Native Born |
|---|---|---|---|
| 2024 | 167,654 | 17.9% | 82.1% |
| 2023 | 167,277 | 17.7% | 82.3% |
| 2022 | 167,989 | 17.0% | 83.0% |
| 2021 | 168,333 | 16.2% | 83.8% |
| 2020 | 165,447 | 16.5% | 83.5% |
| 2019 | 164,861 | 16.8% | 83.2% |
| 2018 | 164,345 | 16.5% | 83.5% |
| 2017 | 163,227 | 15.7% | 84.3% |
| 2016 | 161,777 | 15.7% | 84.3% |
| 2015 | 160,806 | 15.3% | 84.7% |
| 2014 | 159,466 | 15.0% | 85.0% |
| 2013 | 158,348 | 14.6% | 85.4% |
| 2012 | 157,274 | 13.9% | 86.1% |
| 2011 | 156,362 | 14.2% | 85.8% |
| 2010 | 155,462 | 14.2% | 85.8% |
Nativity & Citizenship FAQs for Wyandotte County, Kansas
Approximately 17.9% of residents in Wyandotte County, Kansas were born outside the United States.
The vast majority of residents, roughly 87.8%, are U.S. citizens (including both native-born and naturalized citizens).