Stevens County, Kansas Nativity & Citizenship Status (2024)
Place of birth and citizenship status analysis for Stevens County, Kansas
Stevens County, Kansas Nativity & Citizenship Indicators (2024)
Native Born
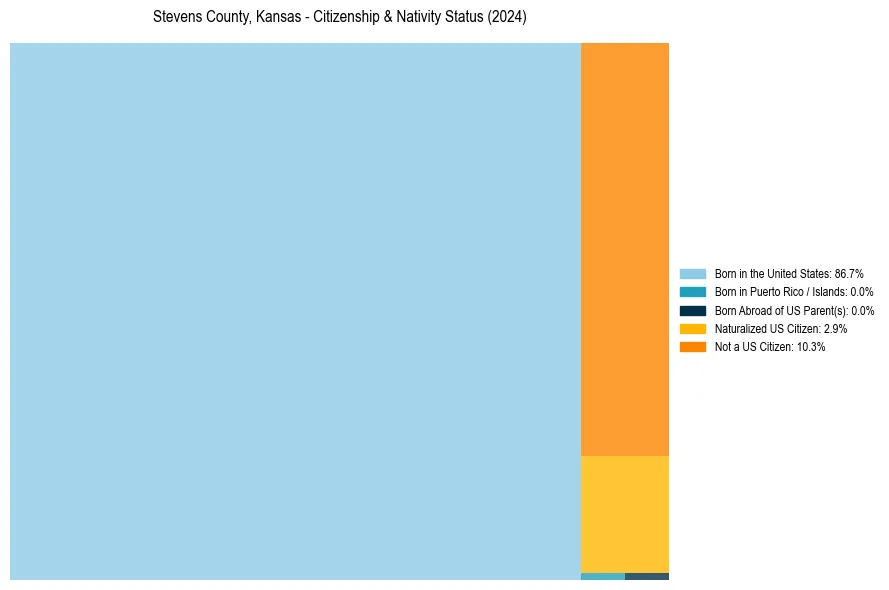
86.7%
Foreign Born
13.3%
Naturalized
2.9%
US Citizens
89.7%
Stevens County, Kansas Nativity & Citizenship Distribution
Stevens County, Kansas Historical Nativity Trends (2010–2024)
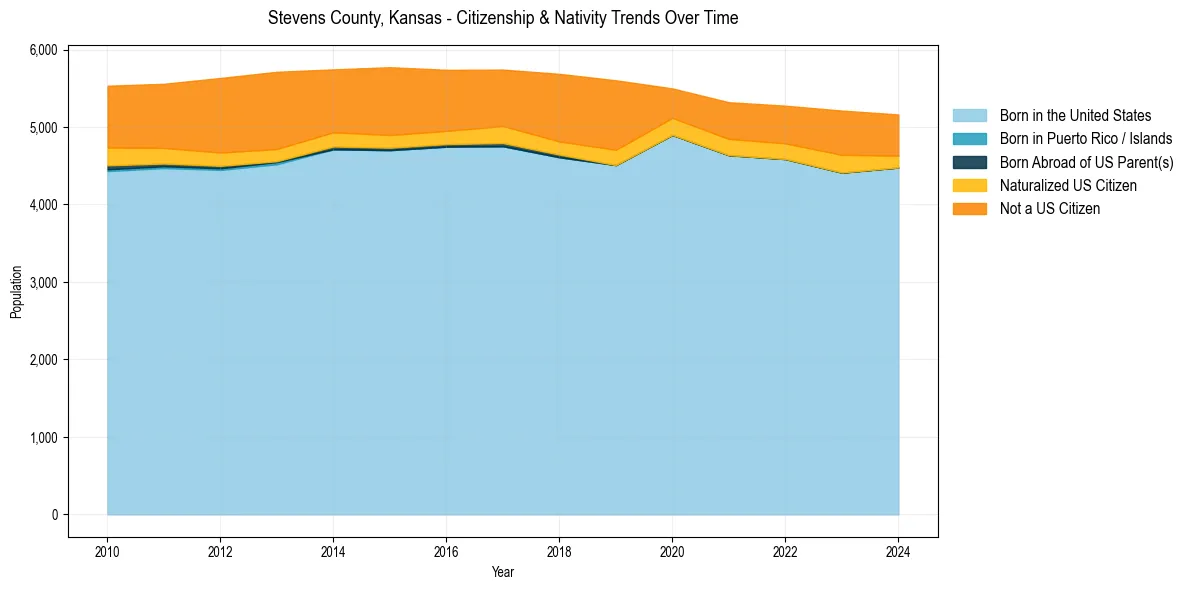
Stevens County, Kansas Population & Nativity History
| Year | Total Pop | Foreign Born | Native Born |
|---|---|---|---|
| 2024 | 5,162 | 13.3% | 86.7% |
| 2023 | 5,212 | 15.3% | 84.7% |
| 2022 | 5,275 | 13.0% | 87.0% |
| 2021 | 5,320 | 12.8% | 87.2% |
| 2020 | 5,498 | 10.9% | 89.1% |
| 2019 | 5,603 | 19.5% | 80.5% |
| 2018 | 5,686 | 18.3% | 81.7% |
| 2017 | 5,741 | 16.5% | 83.5% |
| 2016 | 5,738 | 16.7% | 83.3% |
| 2015 | 5,772 | 18.0% | 82.0% |
| 2014 | 5,744 | 17.3% | 82.7% |
| 2013 | 5,713 | 20.2% | 79.8% |
| 2012 | 5,633 | 20.1% | 79.9% |
| 2011 | 5,558 | 18.5% | 81.5% |
| 2010 | 5,533 | 18.6% | 81.4% |
Nativity & Citizenship FAQs for Stevens County, Kansas
Approximately 13.3% of residents in Stevens County, Kansas were born outside the United States.
The vast majority of residents, roughly 89.7%, are U.S. citizens (including both native-born and naturalized citizens).