Seward County, Kansas Nativity & Citizenship Status (2024)
Place of birth and citizenship status analysis for Seward County, Kansas
Seward County, Kansas Nativity & Citizenship Indicators (2024)
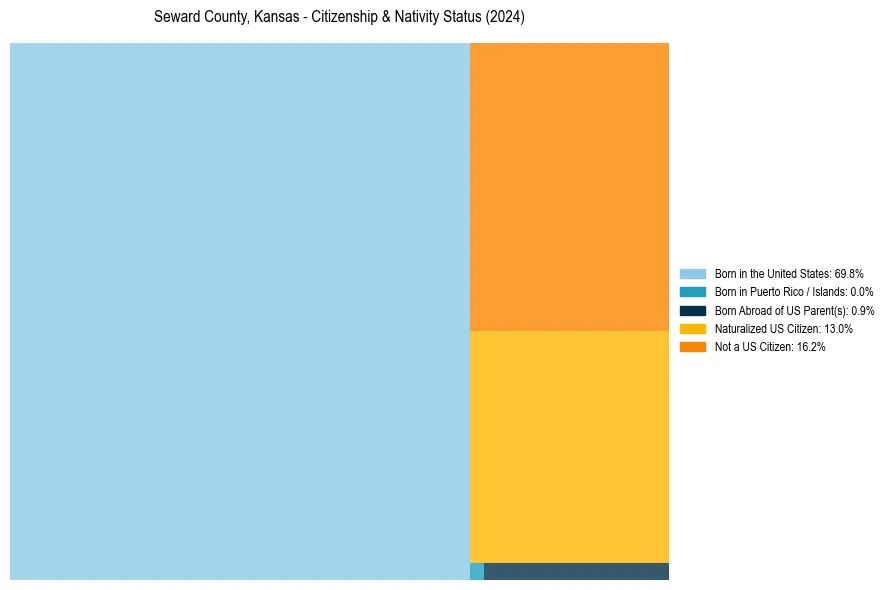
Native Born
70.7%
Foreign Born
29.3%
Naturalized
13.0%
US Citizens
83.8%
Seward County, Kansas Nativity & Citizenship Distribution
Seward County, Kansas Historical Nativity Trends (2010–2024)
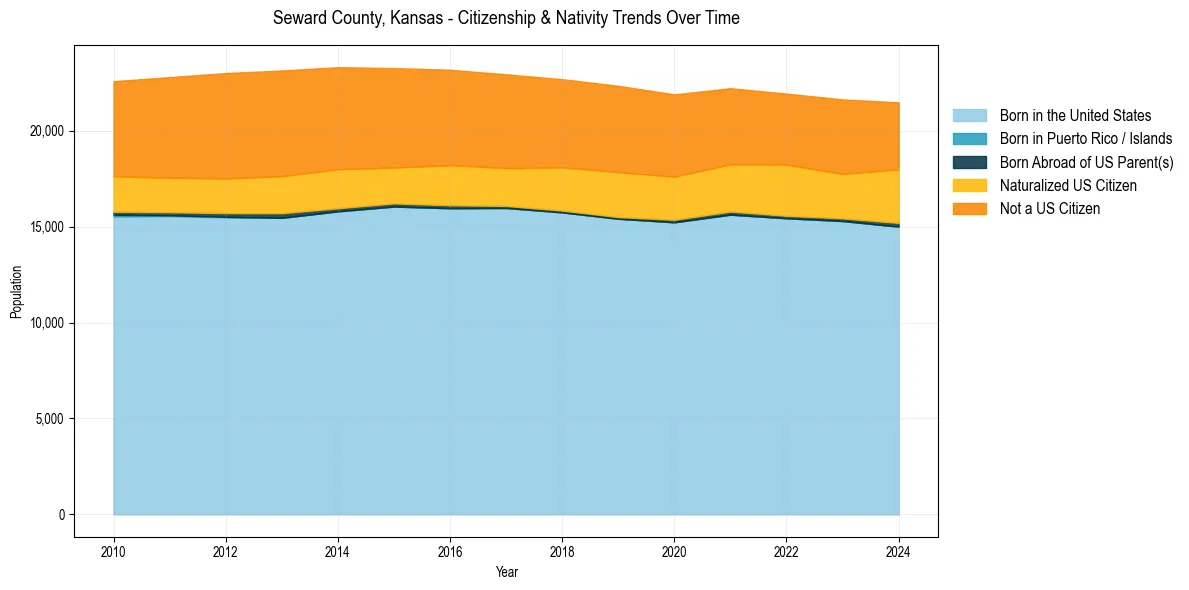
Seward County, Kansas Population & Nativity History
| Year | Total Pop | Foreign Born | Native Born |
|---|---|---|---|
| 2024 | 21,486 | 29.3% | 70.7% |
| 2023 | 21,640 | 28.7% | 71.3% |
| 2022 | 21,942 | 29.0% | 71.0% |
| 2021 | 22,223 | 29.0% | 71.0% |
| 2020 | 21,902 | 29.9% | 70.1% |
| 2019 | 22,349 | 30.6% | 69.4% |
| 2018 | 22,692 | 30.2% | 69.8% |
| 2017 | 22,948 | 29.9% | 70.1% |
| 2016 | 23,185 | 30.5% | 69.5% |
| 2015 | 23,274 | 30.3% | 69.7% |
| 2014 | 23,319 | 31.5% | 68.5% |
| 2013 | 23,146 | 32.2% | 67.8% |
| 2012 | 23,013 | 31.7% | 68.3% |
| 2011 | 22,802 | 30.9% | 69.1% |
| 2010 | 22,588 | 30.1% | 69.9% |
Nativity & Citizenship FAQs for Seward County, Kansas
Approximately 29.3% of residents in Seward County, Kansas were born outside the United States.
The vast majority of residents, roughly 83.8%, are U.S. citizens (including both native-born and naturalized citizens).