Sedgwick County, Kansas Nativity & Citizenship Status (2024)
Place of birth and citizenship status analysis for Sedgwick County, Kansas
Sedgwick County, Kansas Nativity & Citizenship Indicators (2024)
Native Born
91.4%
Foreign Born
8.6%
Naturalized
4.0%
US Citizens
95.4%
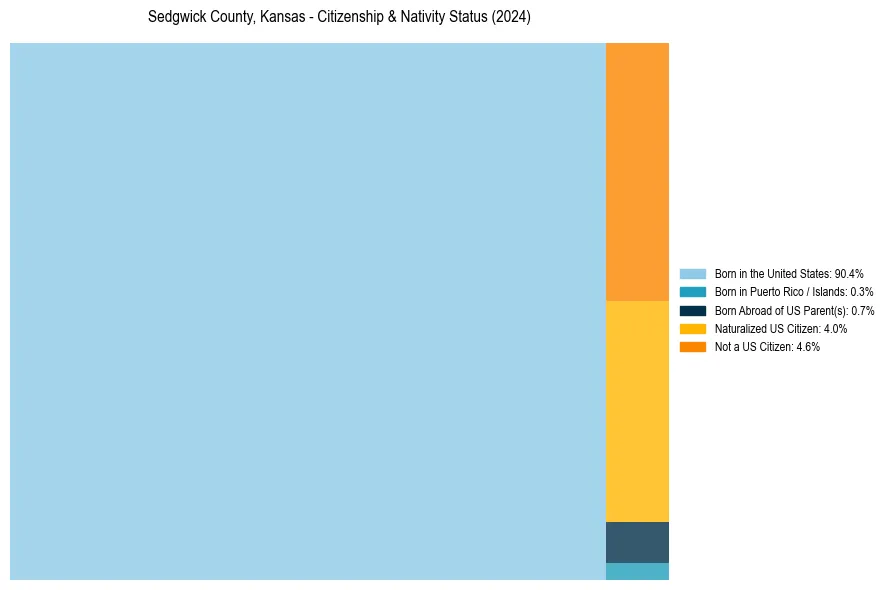
Sedgwick County, Kansas Nativity & Citizenship Distribution
Sedgwick County, Kansas Historical Nativity Trends (2010–2024)
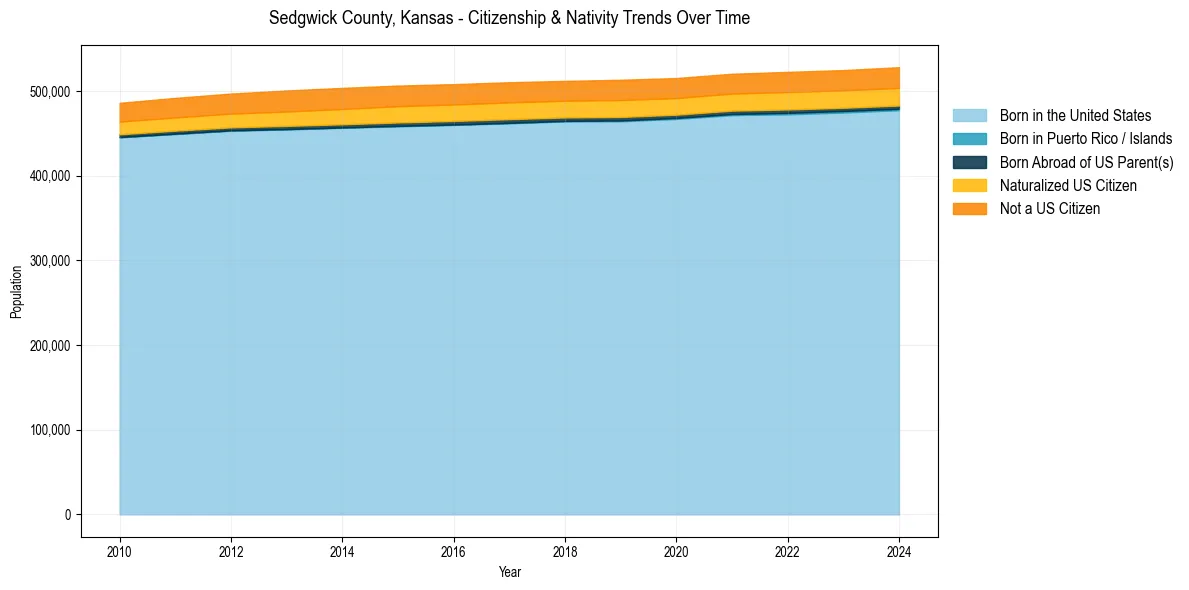
Sedgwick County, Kansas Population & Nativity History
| Year | Total Pop | Foreign Born | Native Born |
|---|---|---|---|
| 2024 | 528,226 | 8.6% | 91.4% |
| 2023 | 524,810 | 8.5% | 91.5% |
| 2022 | 522,700 | 8.5% | 91.5% |
| 2021 | 520,467 | 8.4% | 91.6% |
| 2020 | 515,416 | 8.4% | 91.6% |
| 2019 | 513,375 | 8.6% | 91.4% |
| 2018 | 512,064 | 8.4% | 91.6% |
| 2017 | 510,484 | 8.5% | 91.5% |
| 2016 | 508,221 | 8.6% | 91.4% |
| 2015 | 506,529 | 8.6% | 91.4% |
| 2014 | 503,788 | 8.5% | 91.5% |
| 2013 | 500,768 | 8.4% | 91.6% |
| 2012 | 497,062 | 8.0% | 92.0% |
| 2011 | 491,988 | 7.9% | 92.1% |
| 2010 | 486,123 | 7.6% | 92.4% |
Nativity & Citizenship FAQs for Sedgwick County, Kansas
Approximately 8.6% of residents in Sedgwick County, Kansas were born outside the United States.
The vast majority of residents, roughly 95.4%, are U.S. citizens (including both native-born and naturalized citizens).