Scott County, Kansas Nativity & Citizenship Status (2024)
Place of birth and citizenship status analysis for Scott County, Kansas
Scott County, Kansas Nativity & Citizenship Indicators (2024)
Native Born
91.9%
Foreign Born
8.1%
Naturalized
3.6%
US Citizens
95.5%
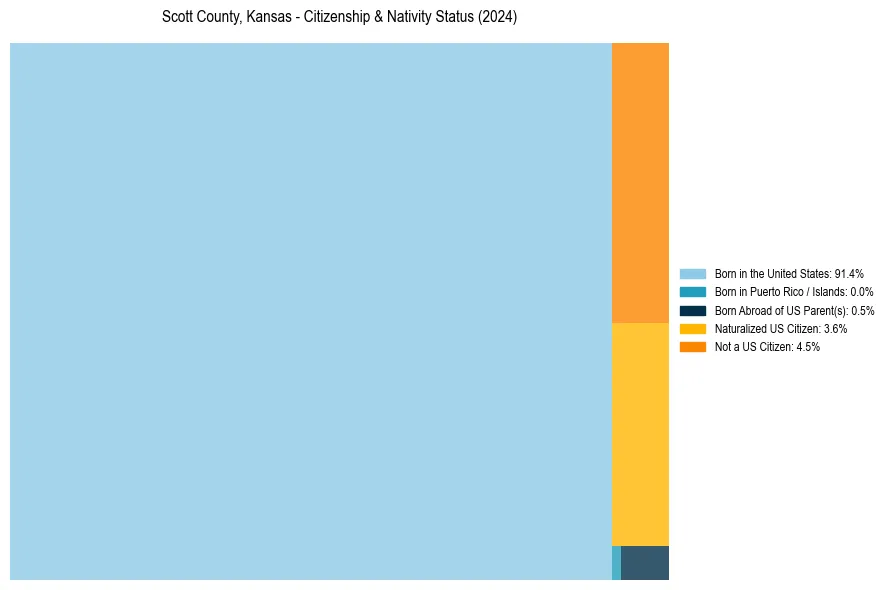
Scott County, Kansas Nativity & Citizenship Distribution
Scott County, Kansas Historical Nativity Trends (2010–2024)
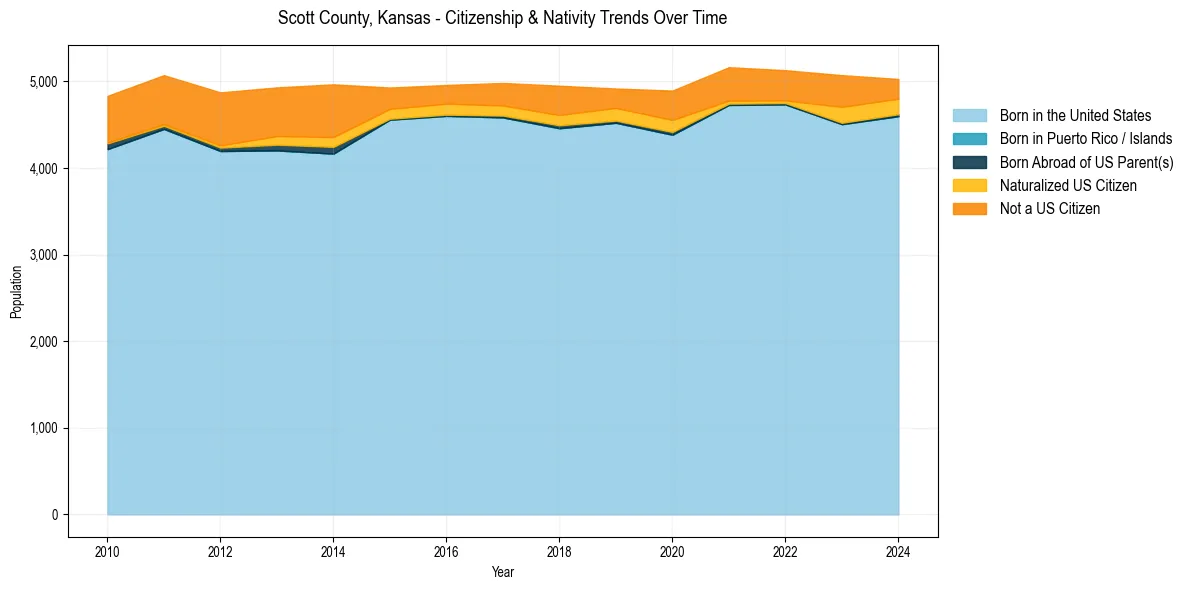
Scott County, Kansas Population & Nativity History
| Year | Total Pop | Foreign Born | Native Born |
|---|---|---|---|
| 2024 | 5,027 | 8.1% | 91.9% |
| 2023 | 5,071 | 10.8% | 89.2% |
| 2022 | 5,128 | 7.4% | 92.6% |
| 2021 | 5,163 | 8.2% | 91.8% |
| 2020 | 4,893 | 9.8% | 90.2% |
| 2019 | 4,917 | 7.5% | 92.5% |
| 2018 | 4,949 | 9.2% | 90.8% |
| 2017 | 4,981 | 7.6% | 92.4% |
| 2016 | 4,958 | 6.9% | 93.1% |
| 2015 | 4,928 | 7.3% | 92.7% |
| 2014 | 4,965 | 14.5% | 85.5% |
| 2013 | 4,930 | 13.4% | 86.6% |
| 2012 | 4,872 | 13.1% | 86.9% |
| 2011 | 5,071 | 11.5% | 88.5% |
| 2010 | 4,832 | 11.4% | 88.6% |
Nativity & Citizenship FAQs for Scott County, Kansas
Approximately 8.1% of residents in Scott County, Kansas were born outside the United States.
The vast majority of residents, roughly 95.5%, are U.S. citizens (including both native-born and naturalized citizens).