Meade County, Kansas Nativity & Citizenship Status (2024)
Place of birth and citizenship status analysis for Meade County, Kansas
Meade County, Kansas Nativity & Citizenship Indicators (2024)
Native Born
88.6%
Foreign Born
11.4%
Naturalized
5.6%
US Citizens
94.2%
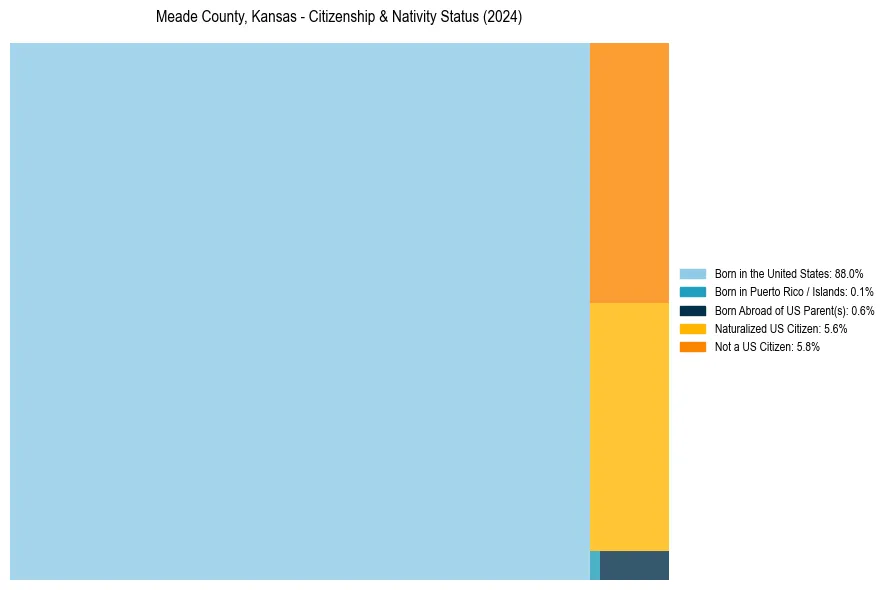
Meade County, Kansas Nativity & Citizenship Distribution
Meade County, Kansas Historical Nativity Trends (2010–2024)
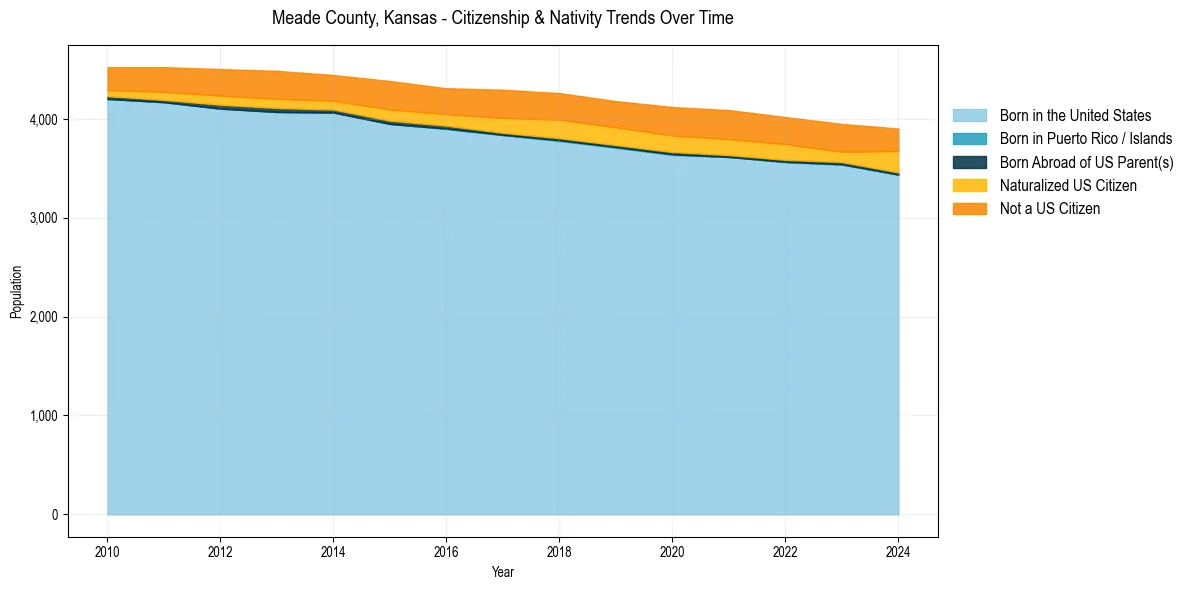
Meade County, Kansas Population & Nativity History
| Year | Total Pop | Foreign Born | Native Born |
|---|---|---|---|
| 2024 | 3,903 | 11.4% | 88.6% |
| 2023 | 3,949 | 9.8% | 90.2% |
| 2022 | 4,019 | 10.8% | 89.2% |
| 2021 | 4,089 | 11.1% | 88.9% |
| 2020 | 4,120 | 11.0% | 89.0% |
| 2019 | 4,180 | 10.6% | 89.4% |
| 2018 | 4,261 | 10.7% | 89.3% |
| 2017 | 4,295 | 10.2% | 89.8% |
| 2016 | 4,310 | 8.8% | 91.2% |
| 2015 | 4,383 | 9.1% | 90.9% |
| 2014 | 4,444 | 7.9% | 92.1% |
| 2013 | 4,486 | 8.4% | 91.6% |
| 2012 | 4,504 | 8.0% | 92.0% |
| 2011 | 4,523 | 7.3% | 92.7% |
| 2010 | 4,523 | 6.5% | 93.5% |
Nativity & Citizenship FAQs for Meade County, Kansas
Approximately 11.4% of residents in Meade County, Kansas were born outside the United States.
The vast majority of residents, roughly 94.2%, are U.S. citizens (including both native-born and naturalized citizens).