Labette County, Kansas Nativity & Citizenship Status (2024)
Place of birth and citizenship status analysis for Labette County, Kansas
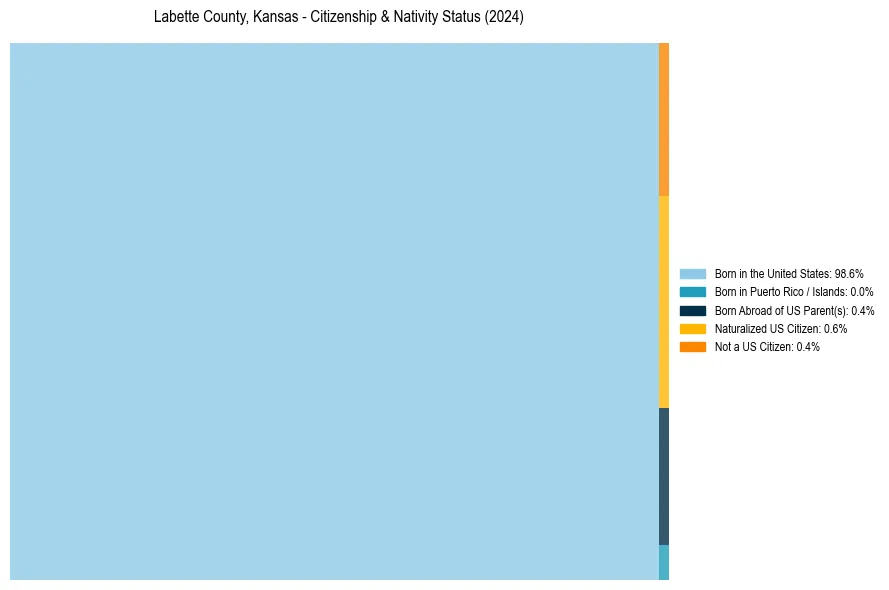
Labette County, Kansas Nativity & Citizenship Indicators (2024)
Native Born
99.0%
Foreign Born
1.0%
Naturalized
0.6%
US Citizens
99.6%
Labette County, Kansas Nativity & Citizenship Distribution
Labette County, Kansas Historical Nativity Trends (2010–2024)
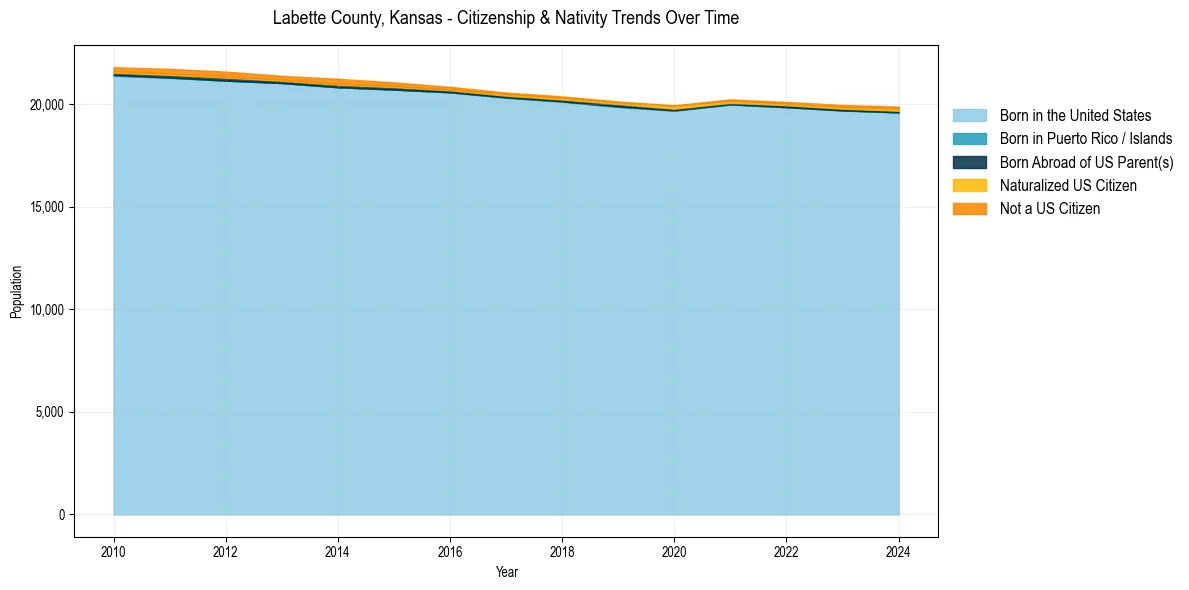
Labette County, Kansas Population & Nativity History
| Year | Total Pop | Foreign Born | Native Born |
|---|---|---|---|
| 2024 | 19,869 | 1.0% | 99.0% |
| 2023 | 19,949 | 0.9% | 99.1% |
| 2022 | 20,096 | 0.8% | 99.2% |
| 2021 | 20,222 | 0.8% | 99.2% |
| 2020 | 19,938 | 0.9% | 99.1% |
| 2019 | 20,119 | 0.6% | 99.4% |
| 2018 | 20,367 | 0.7% | 99.3% |
| 2017 | 20,553 | 0.7% | 99.3% |
| 2016 | 20,833 | 0.8% | 99.2% |
| 2015 | 21,048 | 1.1% | 98.9% |
| 2014 | 21,225 | 1.4% | 98.6% |
| 2013 | 21,369 | 1.1% | 98.9% |
| 2012 | 21,574 | 1.4% | 98.6% |
| 2011 | 21,710 | 1.3% | 98.7% |
| 2010 | 21,791 | 1.2% | 98.8% |
Nativity & Citizenship FAQs for Labette County, Kansas
Approximately 1.0% of residents in Labette County, Kansas were born outside the United States.
The vast majority of residents, roughly 99.6%, are U.S. citizens (including both native-born and naturalized citizens).