Haskell County, Kansas Nativity & Citizenship Status (2024)
Place of birth and citizenship status analysis for Haskell County, Kansas
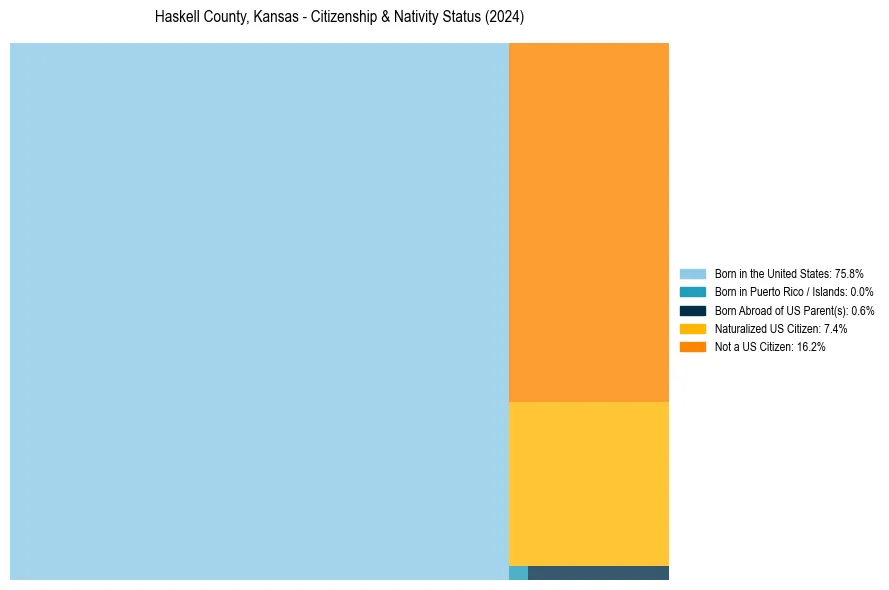
Haskell County, Kansas Nativity & Citizenship Indicators (2024)
Native Born
76.4%
Foreign Born
23.6%
Naturalized
7.4%
US Citizens
83.8%
Haskell County, Kansas Nativity & Citizenship Distribution
Haskell County, Kansas Historical Nativity Trends (2010–2024)
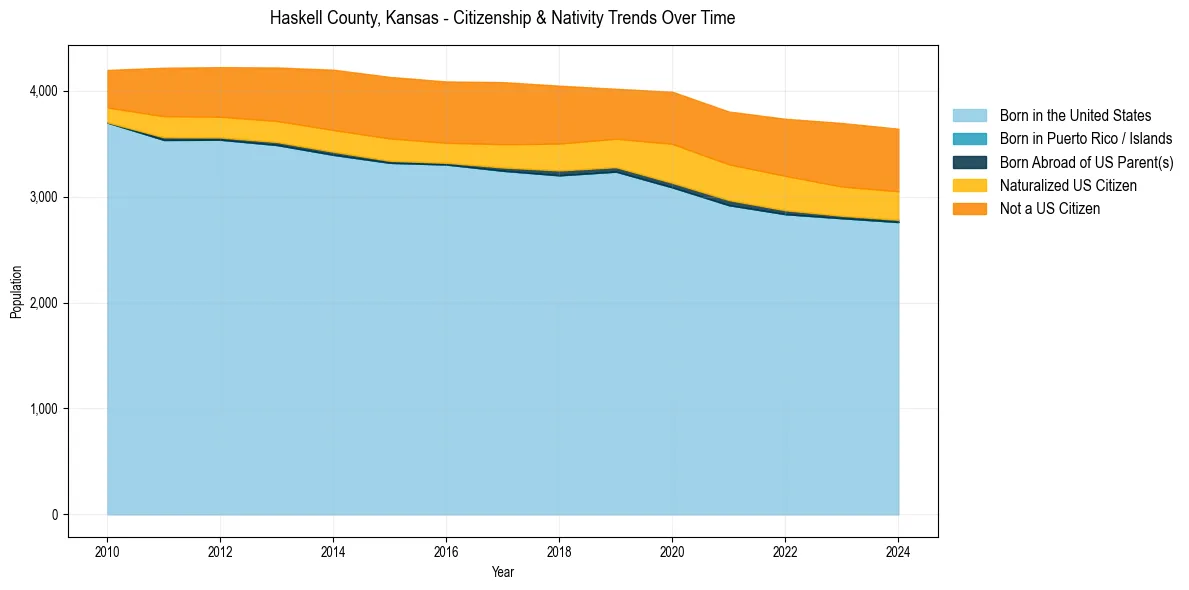
Haskell County, Kansas Population & Nativity History
| Year | Total Pop | Foreign Born | Native Born |
|---|---|---|---|
| 2024 | 3,641 | 23.6% | 76.4% |
| 2023 | 3,695 | 23.7% | 76.3% |
| 2022 | 3,735 | 23.1% | 76.9% |
| 2021 | 3,803 | 22.0% | 78.0% |
| 2020 | 3,990 | 21.6% | 78.4% |
| 2019 | 4,018 | 18.4% | 81.6% |
| 2018 | 4,047 | 19.8% | 80.2% |
| 2017 | 4,081 | 19.8% | 80.2% |
| 2016 | 4,087 | 18.8% | 81.2% |
| 2015 | 4,130 | 19.2% | 80.8% |
| 2014 | 4,198 | 18.5% | 81.5% |
| 2013 | 4,219 | 16.7% | 83.3% |
| 2012 | 4,222 | 15.7% | 84.3% |
| 2011 | 4,217 | 15.6% | 84.4% |
| 2010 | 4,196 | 11.8% | 88.2% |
Nativity & Citizenship FAQs for Haskell County, Kansas
Approximately 23.6% of residents in Haskell County, Kansas were born outside the United States.
The vast majority of residents, roughly 83.8%, are U.S. citizens (including both native-born and naturalized citizens).