Hamilton County, Kansas Nativity & Citizenship Status (2024)
Place of birth and citizenship status analysis for Hamilton County, Kansas
Hamilton County, Kansas Nativity & Citizenship Indicators (2024)
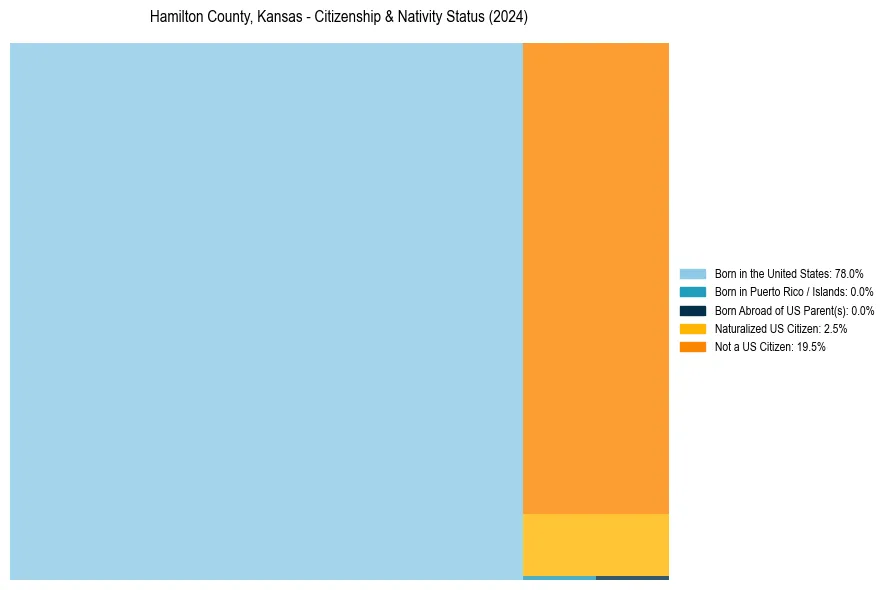
Native Born
78.0%
Foreign Born
22.0%
Naturalized
2.5%
US Citizens
80.5%
Hamilton County, Kansas Nativity & Citizenship Distribution
Hamilton County, Kansas Historical Nativity Trends (2010–2024)
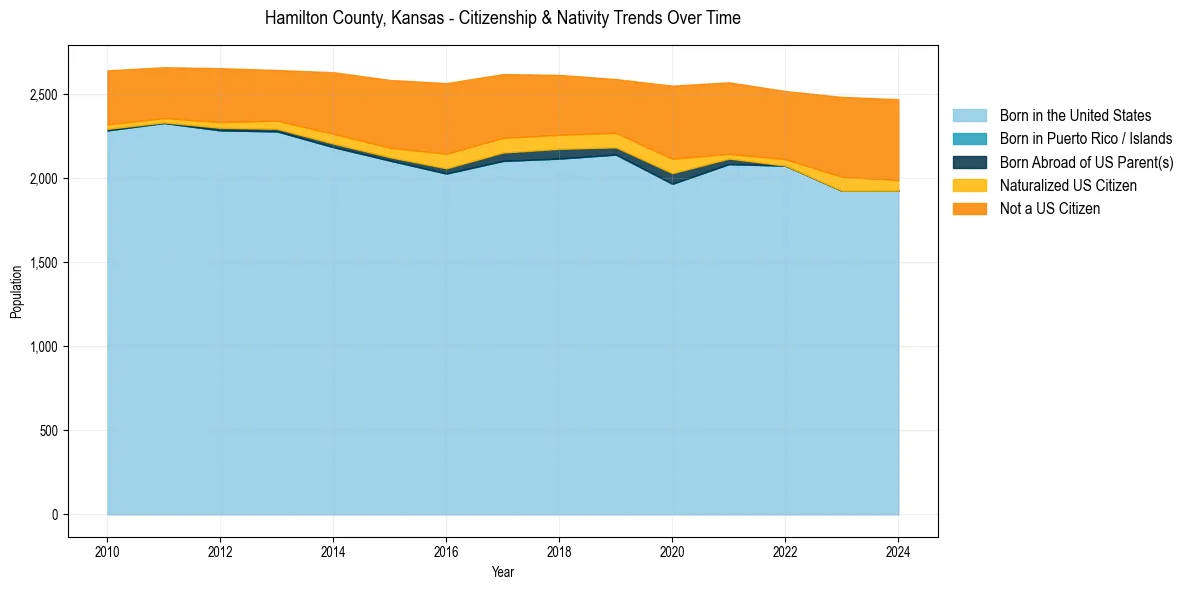
Hamilton County, Kansas Population & Nativity History
| Year | Total Pop | Foreign Born | Native Born |
|---|---|---|---|
| 2024 | 2,471 | 22.0% | 78.0% |
| 2023 | 2,485 | 22.5% | 77.5% |
| 2022 | 2,520 | 17.6% | 82.4% |
| 2021 | 2,572 | 17.7% | 82.3% |
| 2020 | 2,552 | 20.4% | 79.6% |
| 2019 | 2,591 | 15.7% | 84.3% |
| 2018 | 2,616 | 16.8% | 83.2% |
| 2017 | 2,621 | 17.8% | 82.2% |
| 2016 | 2,567 | 19.8% | 80.2% |
| 2015 | 2,586 | 17.8% | 82.2% |
| 2014 | 2,632 | 16.1% | 83.9% |
| 2013 | 2,645 | 13.2% | 86.8% |
| 2012 | 2,656 | 13.4% | 86.6% |
| 2011 | 2,662 | 12.4% | 87.6% |
| 2010 | 2,643 | 13.2% | 86.8% |
Nativity & Citizenship FAQs for Hamilton County, Kansas
Approximately 22.0% of residents in Hamilton County, Kansas were born outside the United States.
The vast majority of residents, roughly 80.5%, are U.S. citizens (including both native-born and naturalized citizens).