Grant County, Kansas Nativity & Citizenship Status (2024)
Place of birth and citizenship status analysis for Grant County, Kansas
Grant County, Kansas Nativity & Citizenship Indicators (2024)
Native Born
75.0%
Foreign Born
25.0%
Naturalized
9.6%
US Citizens
84.6%
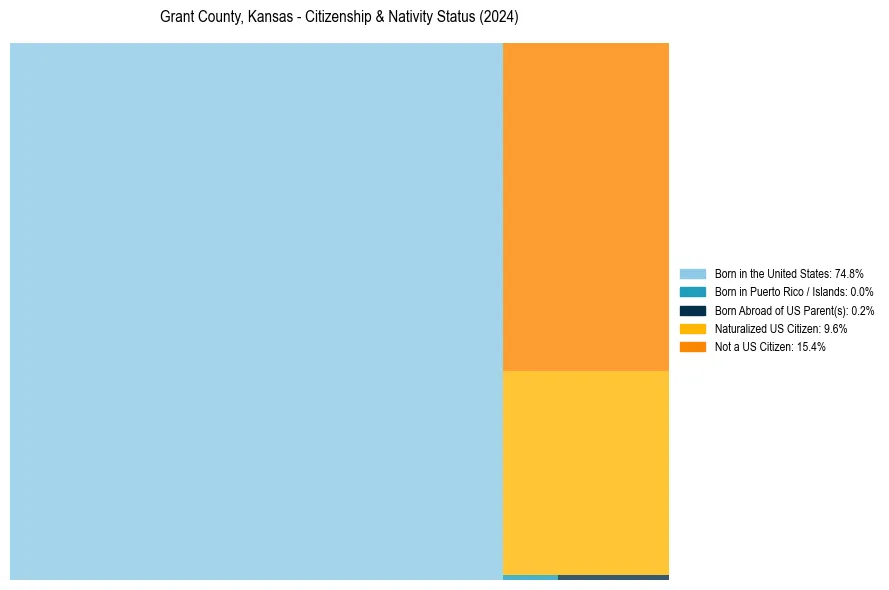
Grant County, Kansas Nativity & Citizenship Distribution
Grant County, Kansas Historical Nativity Trends (2010–2024)
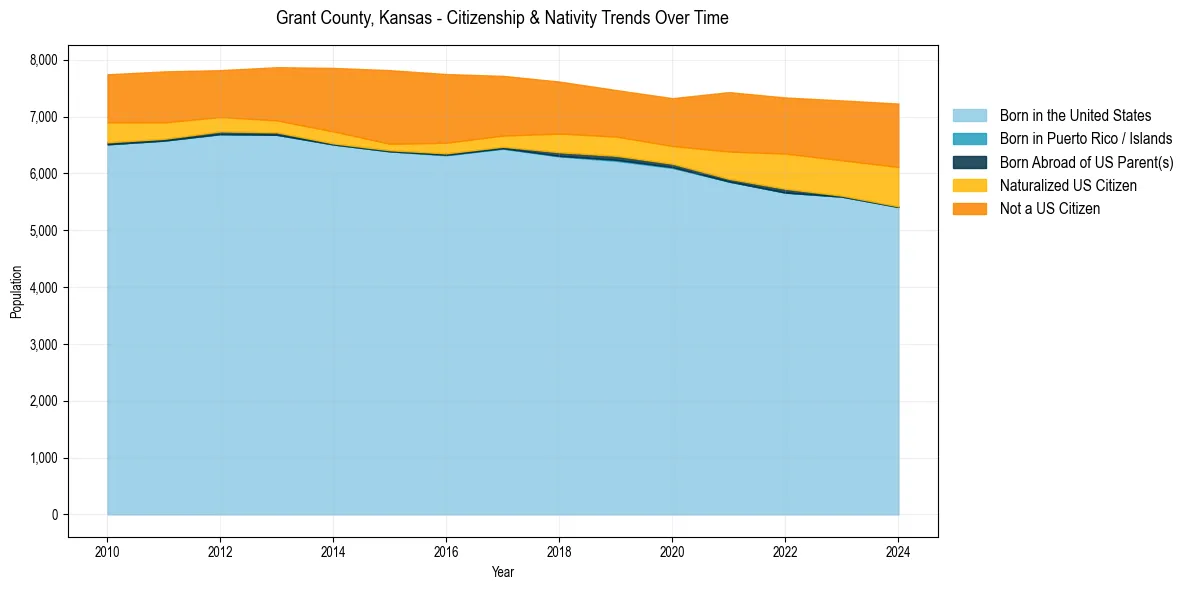
Grant County, Kansas Population & Nativity History
| Year | Total Pop | Foreign Born | Native Born |
|---|---|---|---|
| 2024 | 7,229 | 25.0% | 75.0% |
| 2023 | 7,284 | 23.0% | 77.0% |
| 2022 | 7,336 | 21.9% | 78.1% |
| 2021 | 7,430 | 20.5% | 79.5% |
| 2020 | 7,324 | 15.8% | 84.2% |
| 2019 | 7,467 | 15.5% | 84.5% |
| 2018 | 7,616 | 16.3% | 83.7% |
| 2017 | 7,716 | 16.2% | 83.8% |
| 2016 | 7,748 | 18.0% | 82.0% |
| 2015 | 7,816 | 18.0% | 82.0% |
| 2014 | 7,856 | 16.9% | 83.1% |
| 2013 | 7,869 | 14.6% | 85.4% |
| 2012 | 7,817 | 13.8% | 86.2% |
| 2011 | 7,795 | 15.2% | 84.8% |
| 2010 | 7,744 | 15.5% | 84.5% |
Nativity & Citizenship FAQs for Grant County, Kansas
Approximately 25.0% of residents in Grant County, Kansas were born outside the United States.
The vast majority of residents, roughly 84.6%, are U.S. citizens (including both native-born and naturalized citizens).