Finney County, Kansas Nativity & Citizenship Status (2024)
Place of birth and citizenship status analysis for Finney County, Kansas
Finney County, Kansas Nativity & Citizenship Indicators (2024)
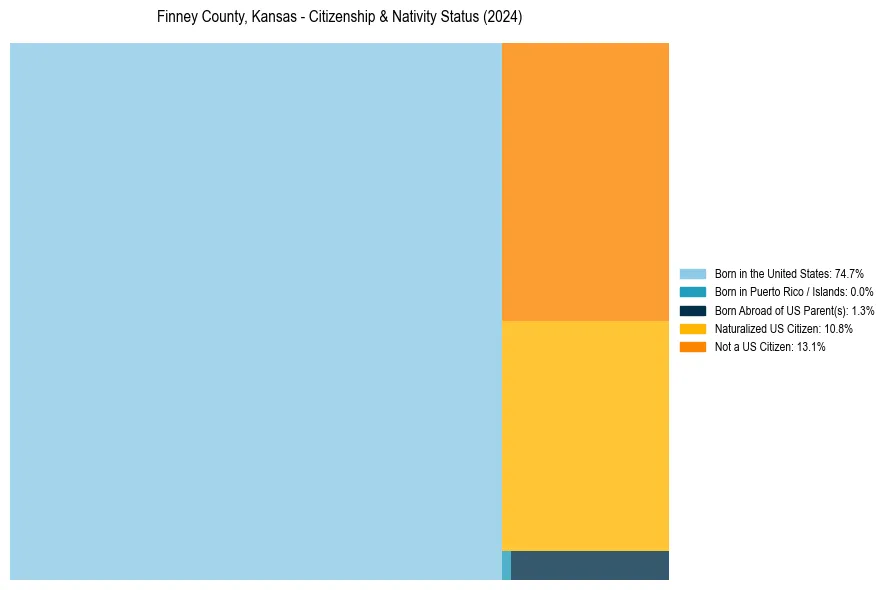
Native Born
76.1%
Foreign Born
23.9%
Naturalized
10.8%
US Citizens
86.9%
Finney County, Kansas Nativity & Citizenship Distribution
Finney County, Kansas Historical Nativity Trends (2010–2024)
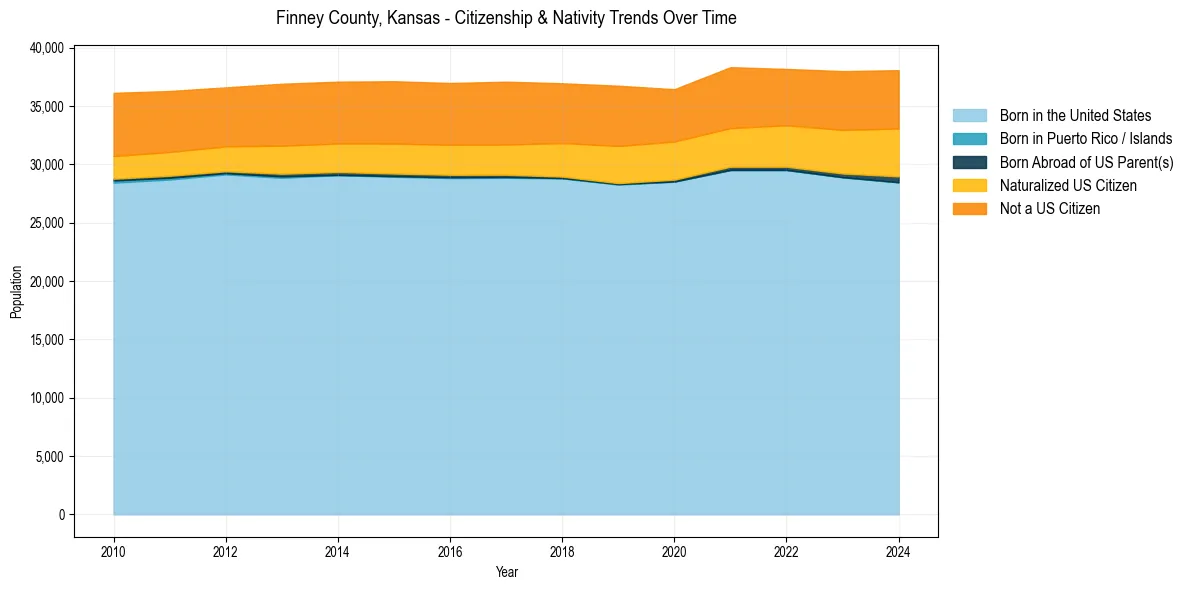
Finney County, Kansas Population & Nativity History
| Year | Total Pop | Foreign Born | Native Born |
|---|---|---|---|
| 2024 | 38,084 | 23.9% | 76.1% |
| 2023 | 38,001 | 23.1% | 76.9% |
| 2022 | 38,187 | 22.0% | 78.0% |
| 2021 | 38,338 | 22.3% | 77.7% |
| 2020 | 36,451 | 21.3% | 78.7% |
| 2019 | 36,750 | 22.7% | 77.3% |
| 2018 | 36,957 | 21.7% | 78.3% |
| 2017 | 37,097 | 21.5% | 78.5% |
| 2016 | 36,983 | 21.3% | 78.7% |
| 2015 | 37,133 | 21.3% | 78.7% |
| 2014 | 37,099 | 20.9% | 79.1% |
| 2013 | 36,920 | 20.9% | 79.1% |
| 2012 | 36,608 | 19.7% | 80.3% |
| 2011 | 36,297 | 20.0% | 80.0% |
| 2010 | 36,139 | 20.4% | 79.6% |
Nativity & Citizenship FAQs for Finney County, Kansas
Approximately 23.9% of residents in Finney County, Kansas were born outside the United States.
The vast majority of residents, roughly 86.9%, are U.S. citizens (including both native-born and naturalized citizens).