Crawford County, Kansas Race & Ethnicity Demographics (2024)
Racial distribution and diversity statistics for Crawford County, Kansas
Crawford County, Kansas Diversity Indicators (2024)
Total Population
39,008
Diversity Score
29.6
Diversity Tier
Moderate-Low
Largest Group
White (Non-Hispanic)
83.4%%
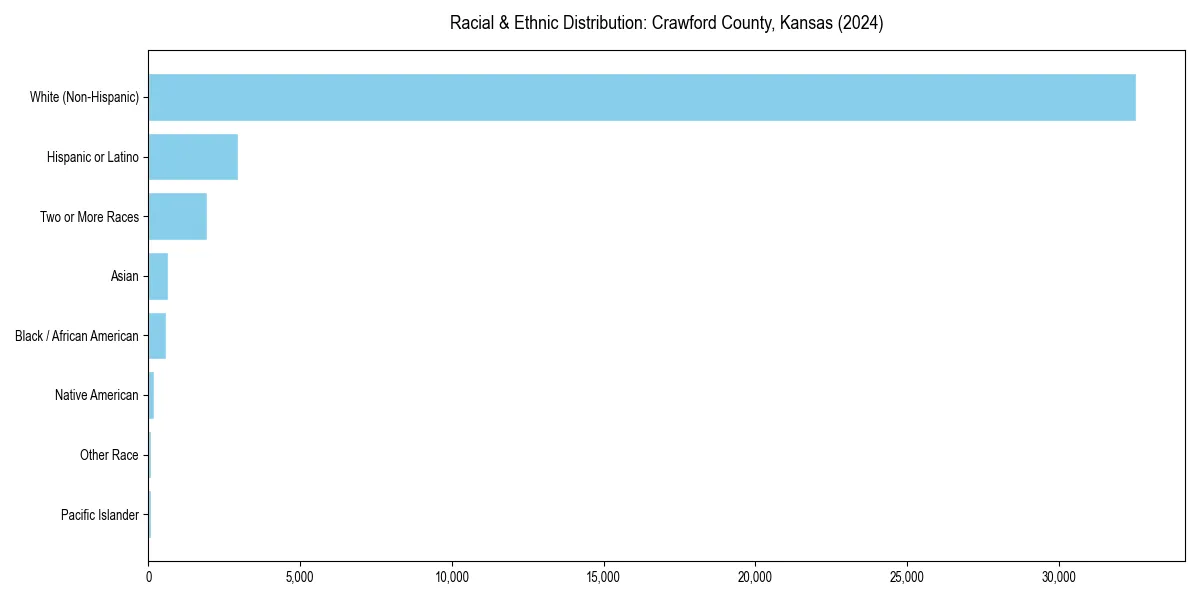
Crawford County, Kansas Racial & Ethnic Breakdown
Crawford County, Kansas Historical Diversity Trend (2010–2024)
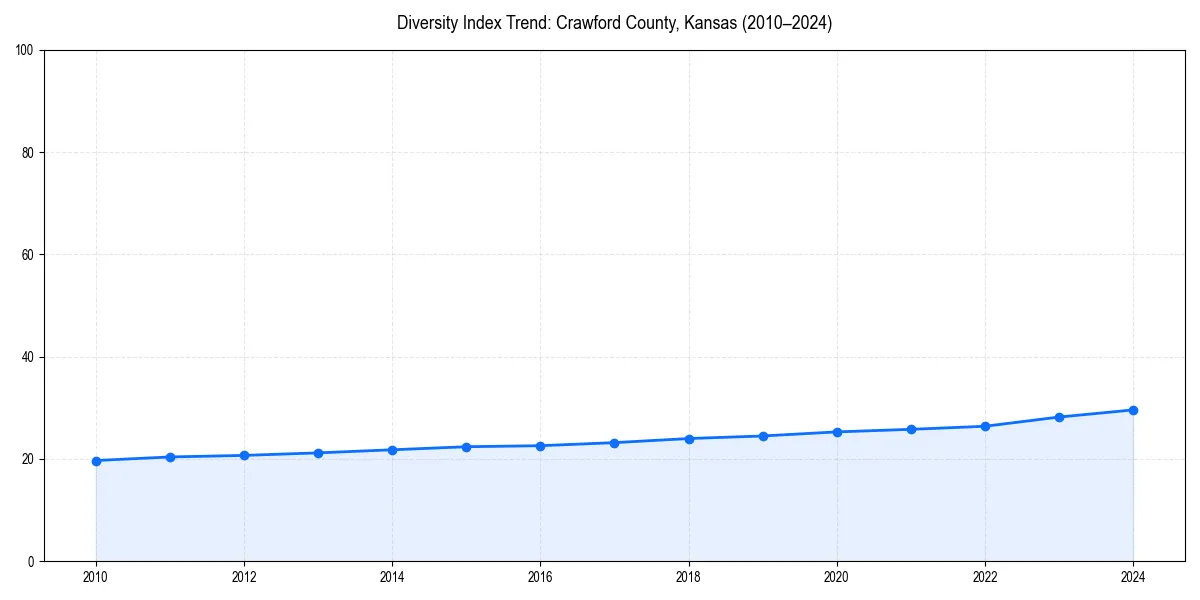
Since 2010, the diversity index of Crawford County, Kansas has increased significantly.
Crawford County, Kansas Population by Race & Ethnicity
| Race / Ethnicity | Population | Percentage |
|---|---|---|
| White (Non-Hispanic) | 32,530 | 83.4% |
| Hispanic or Latino | 2,936 | 7.5% |
| Two or More Races | 1,924 | 4.9% |
| Asian | 655 | 1.7% |
| Black / African American | 585 | 1.5% |
| Native American | 192 | 0.5% |
| Other Race | 98 | 0.3% |
| Pacific Islander | 88 | 0.2% |
Diversity & Demographics FAQs for Crawford County, Kansas
The largest racial or ethnic group in Crawford County, Kansas is White (Non-Hispanic), which makes up 83.4% of the total population.
Since 2010, the diversity index for Crawford County, Kansas has increased significantly. The area currently has a diversity score of 29.6/100, which is considered a Moderate-Low level of diversity.