Sioux County, Iowa Nativity & Citizenship Status (2024)
Place of birth and citizenship status analysis for Sioux County, Iowa
Sioux County, Iowa Nativity & Citizenship Indicators (2024)
Native Born
91.5%
Foreign Born
8.5%
Naturalized
3.1%
US Citizens
94.6%
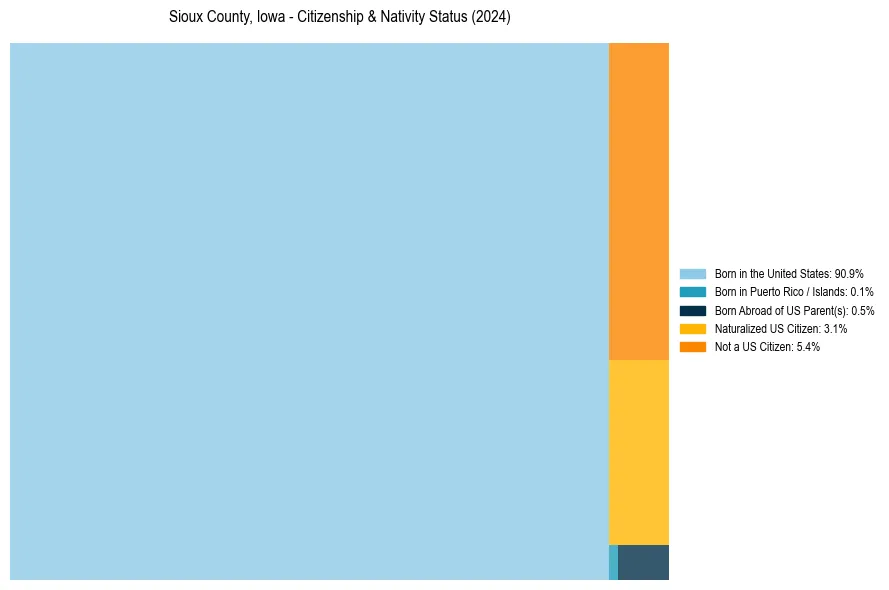
Sioux County, Iowa Nativity & Citizenship Distribution
Sioux County, Iowa Historical Nativity Trends (2010–2024)
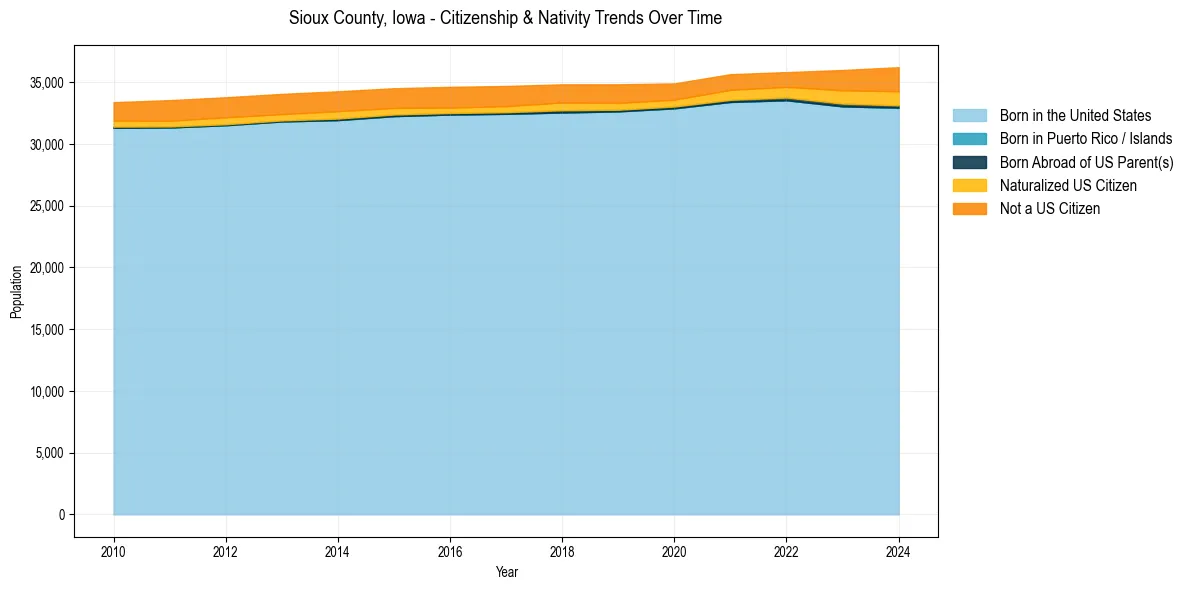
Sioux County, Iowa Population & Nativity History
| Year | Total Pop | Foreign Born | Native Born |
|---|---|---|---|
| 2024 | 36,212 | 8.5% | 91.5% |
| 2023 | 35,984 | 7.6% | 92.4% |
| 2022 | 35,815 | 5.8% | 94.2% |
| 2021 | 35,647 | 5.8% | 94.2% |
| 2020 | 34,900 | 5.4% | 94.6% |
| 2019 | 34,827 | 5.9% | 94.1% |
| 2018 | 34,825 | 6.0% | 94.0% |
| 2017 | 34,692 | 6.1% | 93.9% |
| 2016 | 34,621 | 6.1% | 93.9% |
| 2015 | 34,509 | 6.2% | 93.8% |
| 2014 | 34,261 | 6.4% | 93.6% |
| 2013 | 34,050 | 6.3% | 93.7% |
| 2012 | 33,776 | 6.5% | 93.5% |
| 2011 | 33,545 | 6.4% | 93.6% |
| 2010 | 33,377 | 5.9% | 94.1% |
Nativity & Citizenship FAQs for Sioux County, Iowa
Approximately 8.5% of residents in Sioux County, Iowa were born outside the United States.
The vast majority of residents, roughly 94.6%, are U.S. citizens (including both native-born and naturalized citizens).