Polk County, Iowa Nativity & Citizenship Status (2024)
Place of birth and citizenship status analysis for Polk County, Iowa
Polk County, Iowa Nativity & Citizenship Indicators (2024)
Native Born
89.9%
Foreign Born
10.1%
Naturalized
4.7%
US Citizens
94.6%
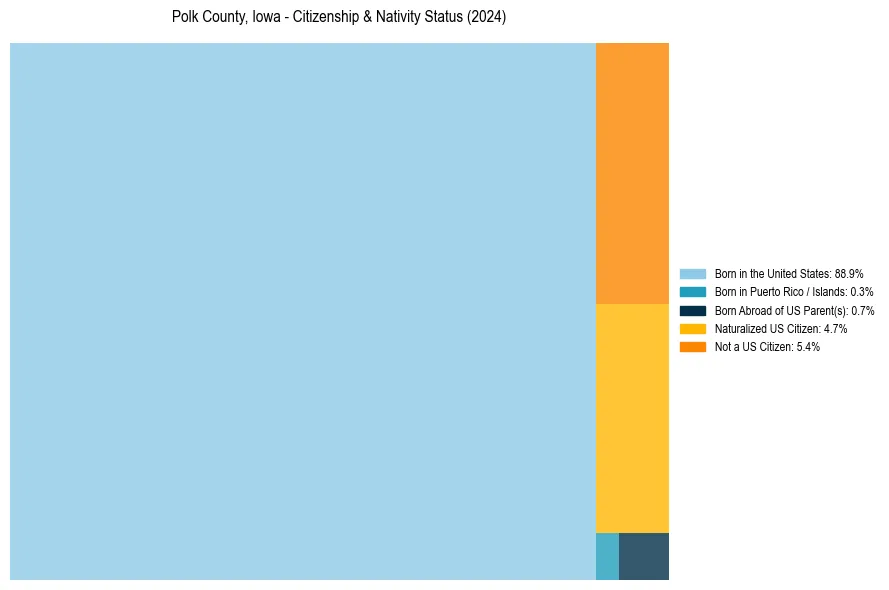
Polk County, Iowa Nativity & Citizenship Distribution
Polk County, Iowa Historical Nativity Trends (2010–2024)
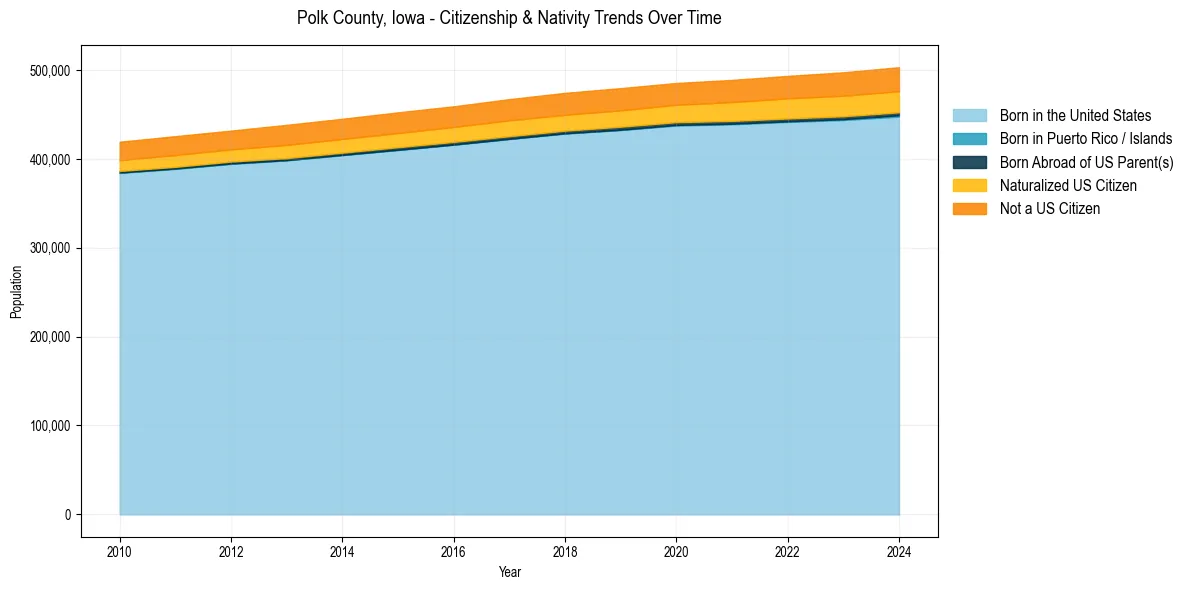
Polk County, Iowa Population & Nativity History
| Year | Total Pop | Foreign Born | Native Born |
|---|---|---|---|
| 2024 | 503,175 | 10.1% | 89.9% |
| 2023 | 497,441 | 10.0% | 90.0% |
| 2022 | 493,378 | 9.7% | 90.3% |
| 2021 | 488,871 | 9.4% | 90.6% |
| 2020 | 485,418 | 9.1% | 90.9% |
| 2019 | 479,612 | 9.1% | 90.9% |
| 2018 | 474,274 | 9.0% | 91.0% |
| 2017 | 467,235 | 8.9% | 91.1% |
| 2016 | 459,159 | 8.7% | 91.3% |
| 2015 | 452,369 | 8.7% | 91.3% |
| 2014 | 445,136 | 8.6% | 91.4% |
| 2013 | 438,307 | 8.5% | 91.5% |
| 2012 | 431,811 | 8.1% | 91.9% |
| 2011 | 425,582 | 8.1% | 91.9% |
| 2010 | 419,301 | 7.8% | 92.2% |
Nativity & Citizenship FAQs for Polk County, Iowa
Approximately 10.1% of residents in Polk County, Iowa were born outside the United States.
The vast majority of residents, roughly 94.6%, are U.S. citizens (including both native-born and naturalized citizens).