Iowa Nativity & Citizenship Status (2024)
Place of birth and citizenship status analysis for Iowa
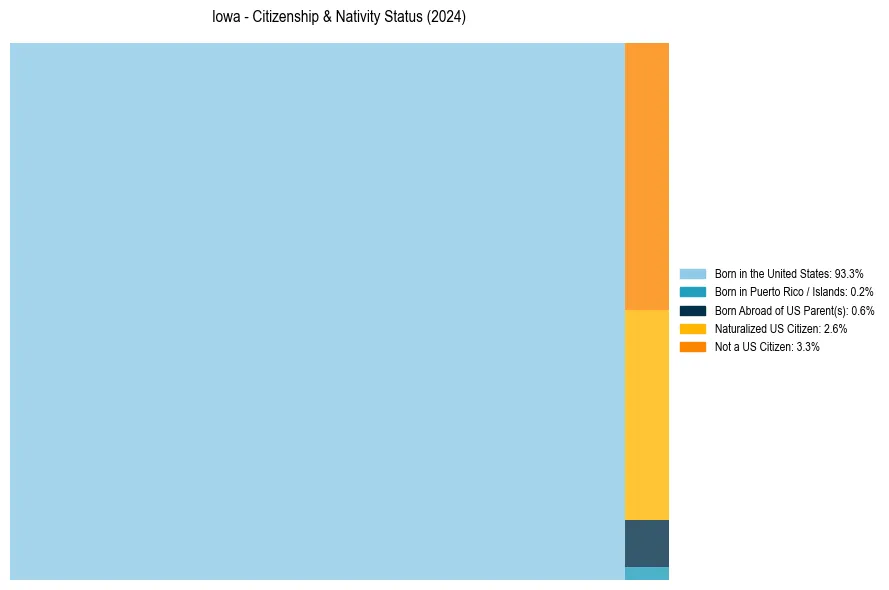
Iowa Nativity & Citizenship Indicators (2024)
Native Born
94.1%
Foreign Born
5.9%
Naturalized
2.6%
US Citizens
96.7%
Iowa Nativity & Citizenship Distribution
Iowa Historical Nativity Trends (2010–2024)
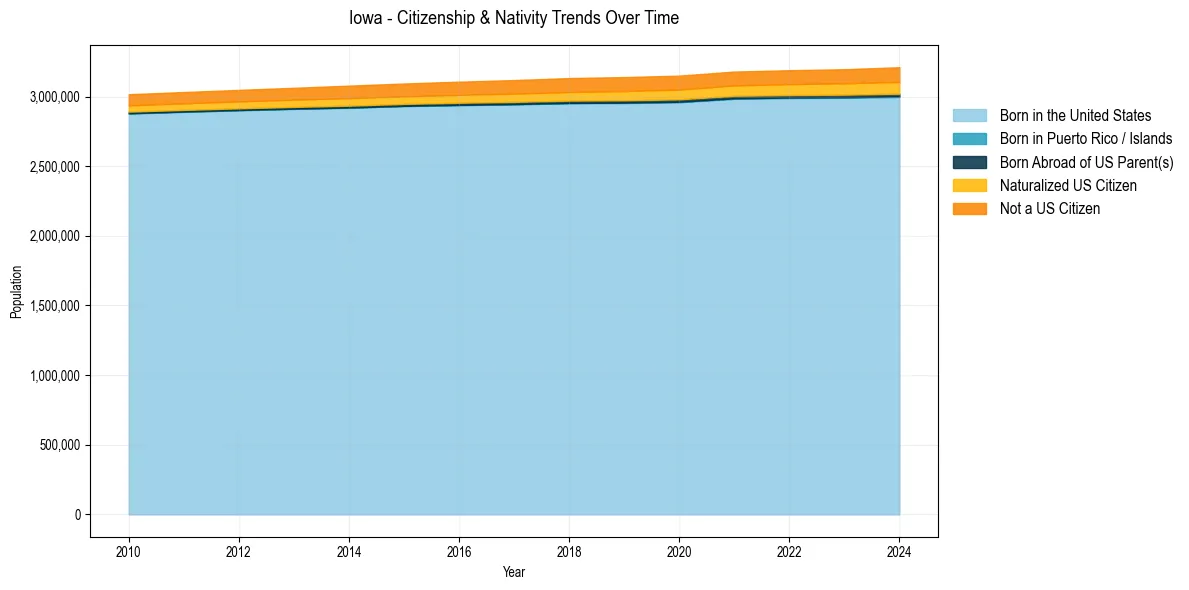
Iowa Population & Nativity History
| Year | Total Pop | Foreign Born | Native Born |
|---|---|---|---|
| 2024 | 3,210,507 | 5.9% | 94.1% |
| 2023 | 3,195,937 | 5.7% | 94.3% |
| 2022 | 3,188,836 | 5.6% | 94.4% |
| 2021 | 3,179,090 | 5.5% | 94.5% |
| 2020 | 3,150,011 | 5.4% | 94.6% |
| 2019 | 3,139,508 | 5.3% | 94.7% |
| 2018 | 3,132,499 | 5.2% | 94.8% |
| 2017 | 3,118,102 | 5.0% | 95.0% |
| 2016 | 3,106,589 | 4.9% | 95.1% |
| 2015 | 3,093,526 | 4.7% | 95.3% |
| 2014 | 3,078,116 | 4.7% | 95.3% |
| 2013 | 3,062,553 | 4.5% | 95.5% |
| 2012 | 3,047,646 | 4.3% | 95.7% |
| 2011 | 3,032,266 | 4.2% | 95.8% |
| 2010 | 3,016,267 | 4.1% | 95.9% |
Nativity & Citizenship FAQs for Iowa
Approximately 5.9% of residents in Iowa were born outside the United States.
The vast majority of residents, roughly 96.7%, are U.S. citizens (including both native-born and naturalized citizens).