Linn County, Iowa Nativity & Citizenship Status (2024)
Place of birth and citizenship status analysis for Linn County, Iowa
Linn County, Iowa Nativity & Citizenship Indicators (2024)
Native Born
94.4%
Foreign Born
5.6%
Naturalized
3.0%
US Citizens
97.5%
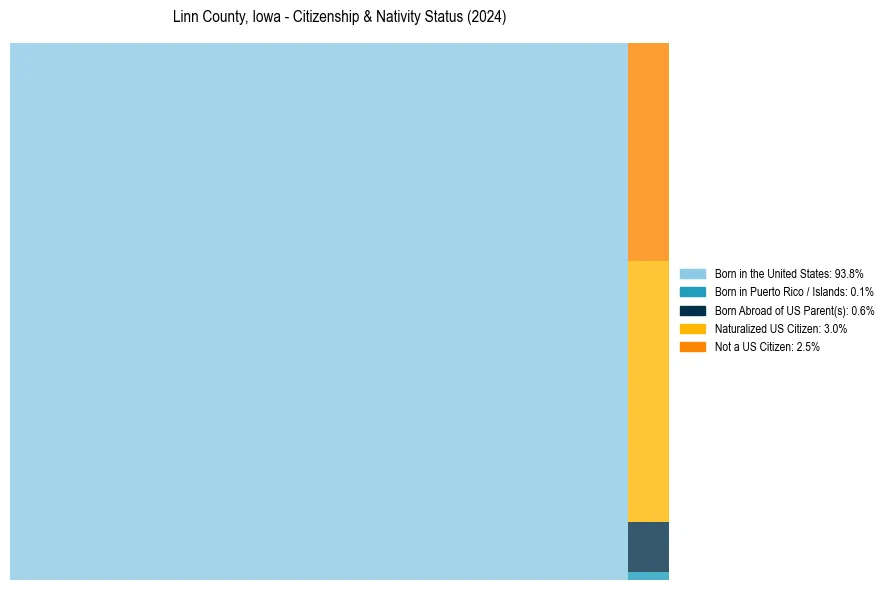
Linn County, Iowa Nativity & Citizenship Distribution
Linn County, Iowa Historical Nativity Trends (2010–2024)
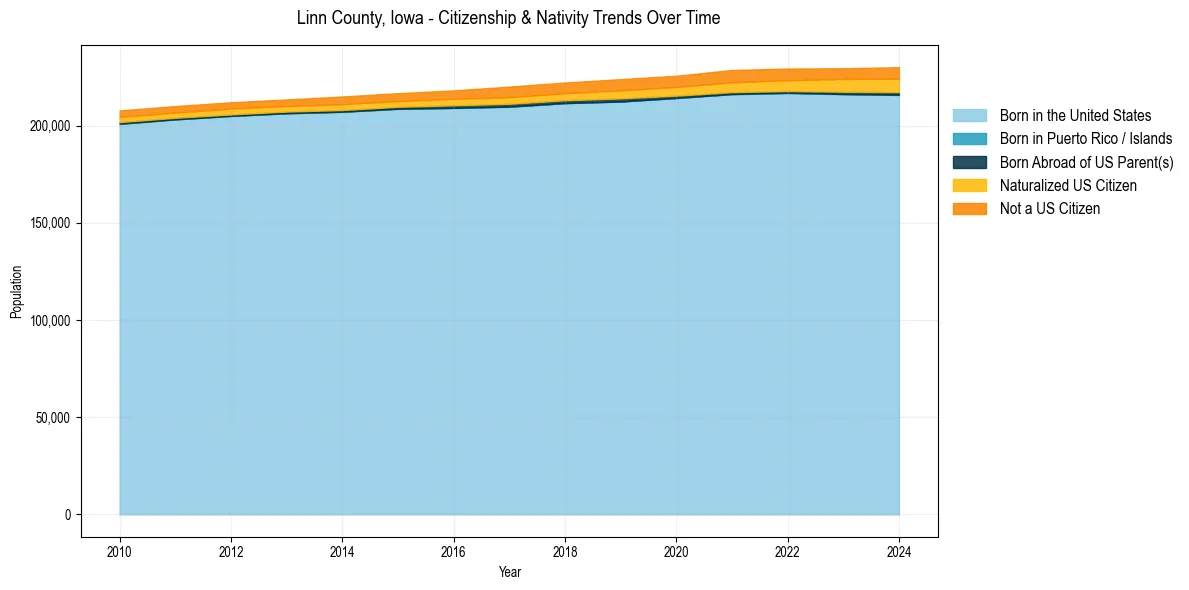
Linn County, Iowa Population & Nativity History
| Year | Total Pop | Foreign Born | Native Born |
|---|---|---|---|
| 2024 | 230,004 | 5.6% | 94.4% |
| 2023 | 229,463 | 5.3% | 94.7% |
| 2022 | 229,308 | 5.0% | 95.0% |
| 2021 | 228,567 | 5.0% | 95.0% |
| 2020 | 225,601 | 4.5% | 95.5% |
| 2019 | 223,861 | 4.4% | 95.6% |
| 2018 | 222,121 | 4.1% | 95.9% |
| 2017 | 220,008 | 4.0% | 96.0% |
| 2016 | 218,076 | 3.5% | 96.5% |
| 2015 | 216,640 | 3.2% | 96.8% |
| 2014 | 214,927 | 3.2% | 96.8% |
| 2013 | 213,425 | 2.9% | 97.1% |
| 2012 | 211,954 | 2.9% | 97.1% |
| 2011 | 210,011 | 2.9% | 97.1% |
| 2010 | 207,765 | 2.9% | 97.1% |
Nativity & Citizenship FAQs for Linn County, Iowa
Approximately 5.6% of residents in Linn County, Iowa were born outside the United States.
The vast majority of residents, roughly 97.5%, are U.S. citizens (including both native-born and naturalized citizens).