Johnson County, Iowa Nativity & Citizenship Status (2024)
Place of birth and citizenship status analysis for Johnson County, Iowa
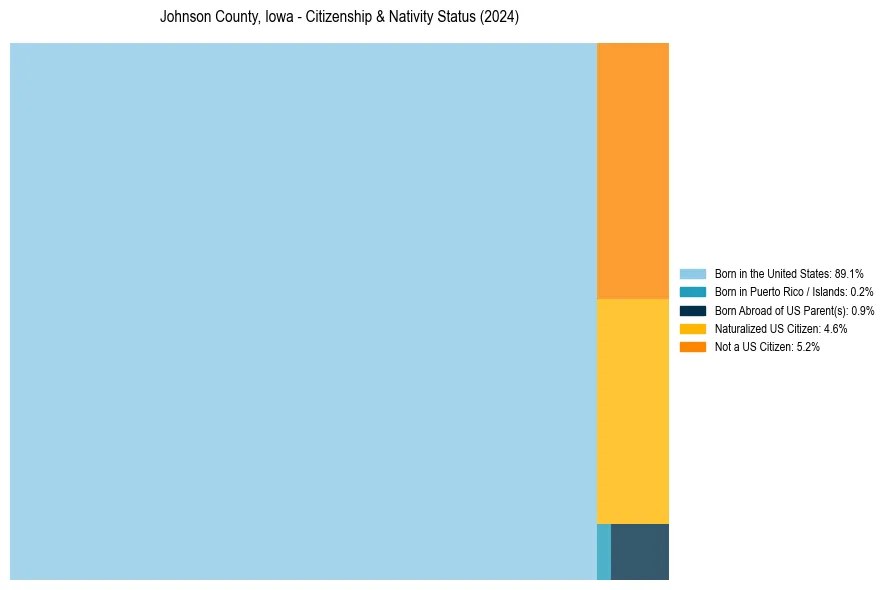
Johnson County, Iowa Nativity & Citizenship Indicators (2024)
Native Born
90.2%
Foreign Born
9.8%
Naturalized
4.6%
US Citizens
94.8%
Johnson County, Iowa Nativity & Citizenship Distribution
Johnson County, Iowa Historical Nativity Trends (2010–2024)
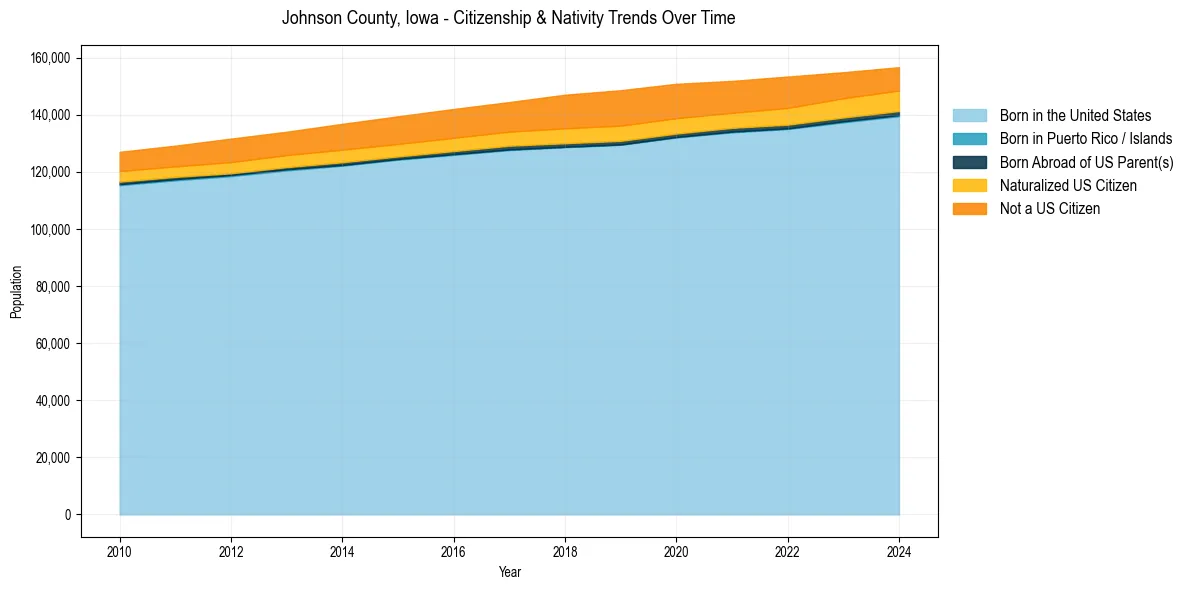
Johnson County, Iowa Population & Nativity History
| Year | Total Pop | Foreign Born | Native Born |
|---|---|---|---|
| 2024 | 156,639 | 9.8% | 90.2% |
| 2023 | 154,881 | 10.2% | 89.8% |
| 2022 | 153,360 | 11.0% | 89.0% |
| 2021 | 151,833 | 10.8% | 89.2% |
| 2020 | 150,819 | 11.6% | 88.4% |
| 2019 | 148,577 | 11.9% | 88.1% |
| 2018 | 147,001 | 11.6% | 88.4% |
| 2017 | 144,425 | 10.6% | 89.4% |
| 2016 | 142,006 | 10.4% | 89.6% |
| 2015 | 139,436 | 10.1% | 89.9% |
| 2014 | 136,802 | 9.8% | 90.2% |
| 2013 | 134,034 | 9.3% | 90.7% |
| 2012 | 131,627 | 9.2% | 90.8% |
| 2011 | 129,159 | 8.5% | 91.5% |
| 2010 | 126,994 | 8.2% | 91.8% |
Nativity & Citizenship FAQs for Johnson County, Iowa
Approximately 9.8% of residents in Johnson County, Iowa were born outside the United States.
The vast majority of residents, roughly 94.8%, are U.S. citizens (including both native-born and naturalized citizens).