Hamilton County, Iowa Nativity & Citizenship Status (2024)
Place of birth and citizenship status analysis for Hamilton County, Iowa
Hamilton County, Iowa Nativity & Citizenship Indicators (2024)
Native Born
93.6%
Foreign Born
6.4%
Naturalized
1.3%
US Citizens
94.9%
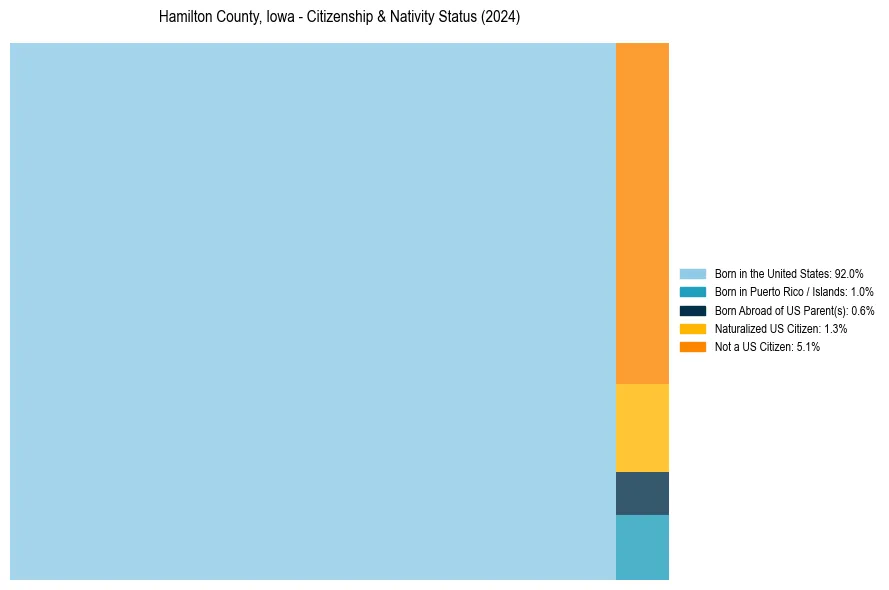
Hamilton County, Iowa Nativity & Citizenship Distribution
Hamilton County, Iowa Historical Nativity Trends (2010–2024)
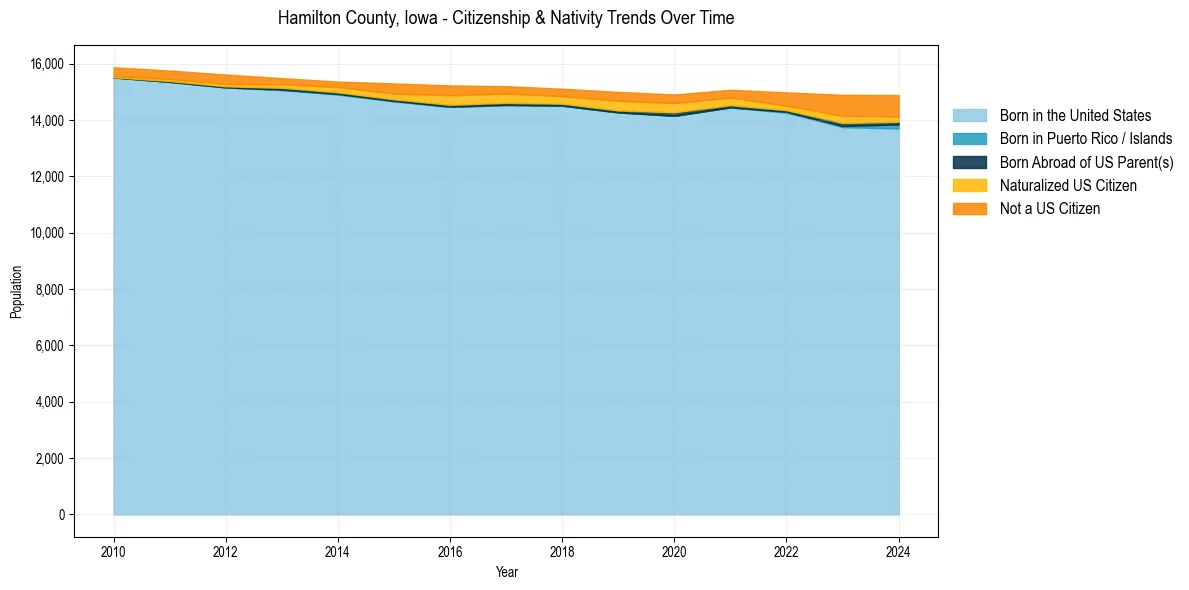
Hamilton County, Iowa Population & Nativity History
| Year | Total Pop | Foreign Born | Native Born |
|---|---|---|---|
| 2024 | 14,886 | 6.4% | 93.6% |
| 2023 | 14,893 | 6.7% | 93.3% |
| 2022 | 14,979 | 4.2% | 95.8% |
| 2021 | 15,073 | 3.6% | 96.4% |
| 2020 | 14,905 | 4.3% | 95.7% |
| 2019 | 14,997 | 4.4% | 95.6% |
| 2018 | 15,110 | 3.5% | 96.5% |
| 2017 | 15,201 | 3.9% | 96.1% |
| 2016 | 15,227 | 4.5% | 95.5% |
| 2015 | 15,297 | 3.7% | 96.3% |
| 2014 | 15,363 | 2.5% | 97.5% |
| 2013 | 15,486 | 2.2% | 97.8% |
| 2012 | 15,614 | 2.7% | 97.3% |
| 2011 | 15,755 | 2.4% | 97.6% |
| 2010 | 15,874 | 2.2% | 97.8% |
Nativity & Citizenship FAQs for Hamilton County, Iowa
Approximately 6.4% of residents in Hamilton County, Iowa were born outside the United States.
The vast majority of residents, roughly 94.9%, are U.S. citizens (including both native-born and naturalized citizens).