Dallas County, Iowa Nativity & Citizenship Status (2024)
Place of birth and citizenship status analysis for Dallas County, Iowa
Dallas County, Iowa Nativity & Citizenship Indicators (2024)
Native Born
89.6%
Foreign Born
10.4%
Naturalized
5.2%
US Citizens
94.8%
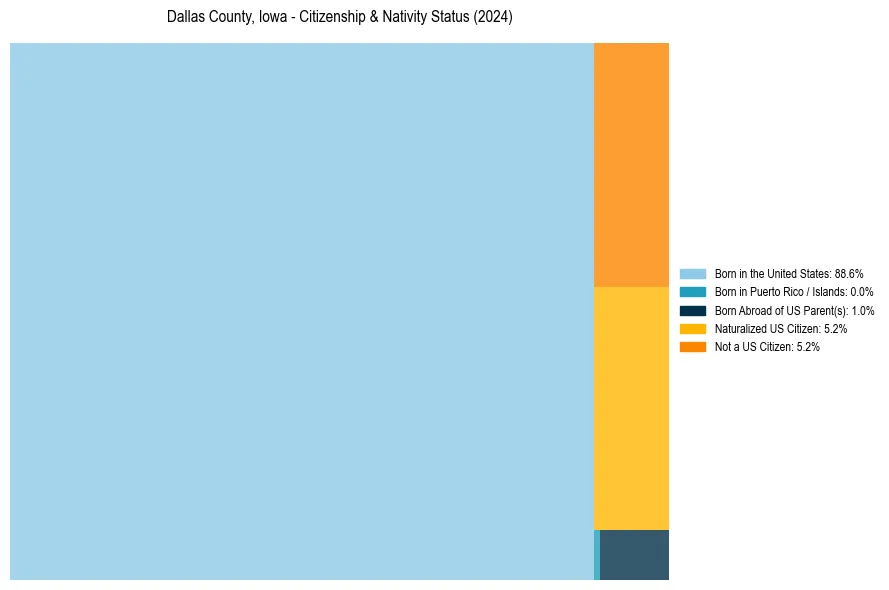
Dallas County, Iowa Nativity & Citizenship Distribution
Dallas County, Iowa Historical Nativity Trends (2010–2024)
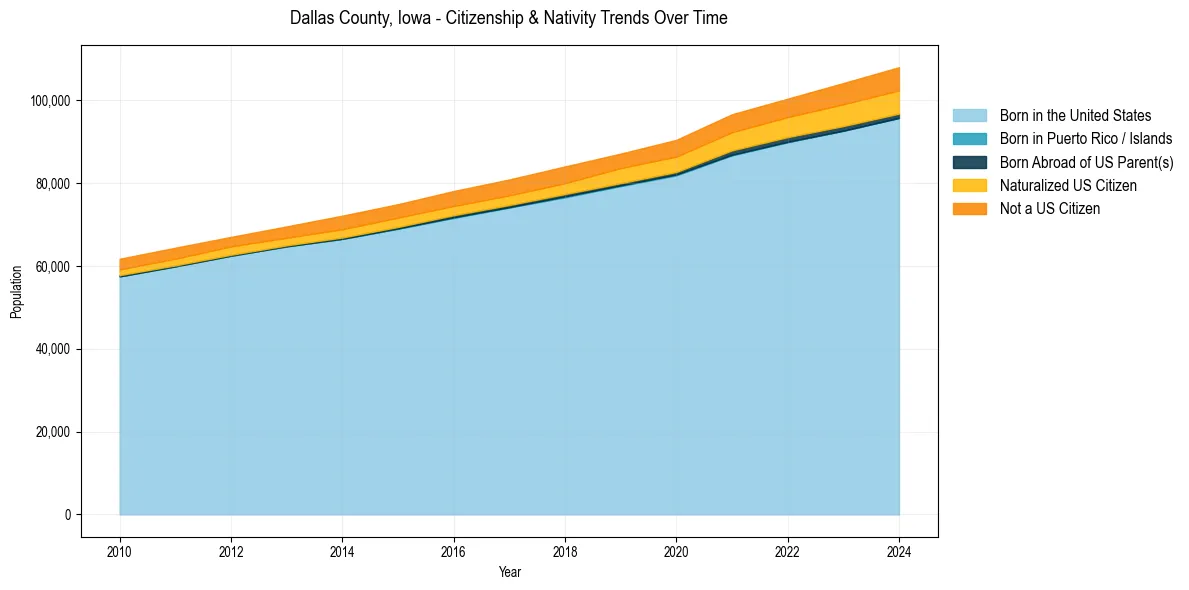
Dallas County, Iowa Population & Nativity History
| Year | Total Pop | Foreign Born | Native Born |
|---|---|---|---|
| 2024 | 107,968 | 10.4% | 89.6% |
| 2023 | 104,136 | 10.0% | 90.0% |
| 2022 | 100,367 | 9.3% | 90.7% |
| 2021 | 96,604 | 9.0% | 91.0% |
| 2020 | 90,418 | 8.6% | 91.4% |
| 2019 | 87,099 | 8.2% | 91.8% |
| 2018 | 84,002 | 7.9% | 92.1% |
| 2017 | 80,864 | 7.6% | 92.4% |
| 2016 | 78,074 | 7.5% | 92.5% |
| 2015 | 74,892 | 7.4% | 92.6% |
| 2014 | 72,124 | 7.3% | 92.7% |
| 2013 | 69,526 | 6.6% | 93.4% |
| 2012 | 66,997 | 6.5% | 93.5% |
| 2011 | 64,383 | 6.6% | 93.4% |
| 2010 | 61,714 | 6.4% | 93.6% |
Nativity & Citizenship FAQs for Dallas County, Iowa
Approximately 10.4% of residents in Dallas County, Iowa were born outside the United States.
The vast majority of residents, roughly 94.8%, are U.S. citizens (including both native-born and naturalized citizens).