Crawford County, Iowa Nativity & Citizenship Status (2024)
Place of birth and citizenship status analysis for Crawford County, Iowa
Crawford County, Iowa Nativity & Citizenship Indicators (2024)
Native Born
82.5%
Foreign Born
17.5%
Naturalized
7.9%
US Citizens
90.4%
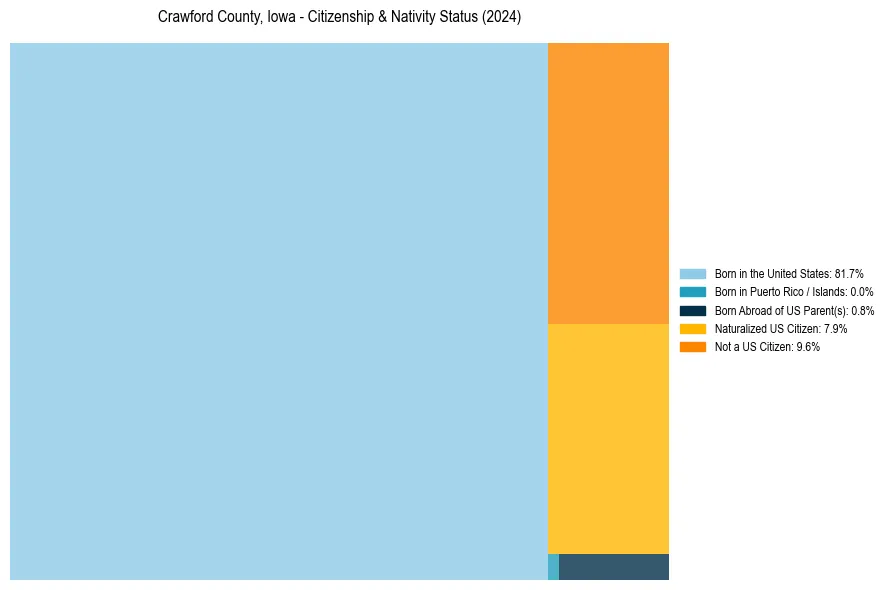
Crawford County, Iowa Nativity & Citizenship Distribution
Crawford County, Iowa Historical Nativity Trends (2010–2024)
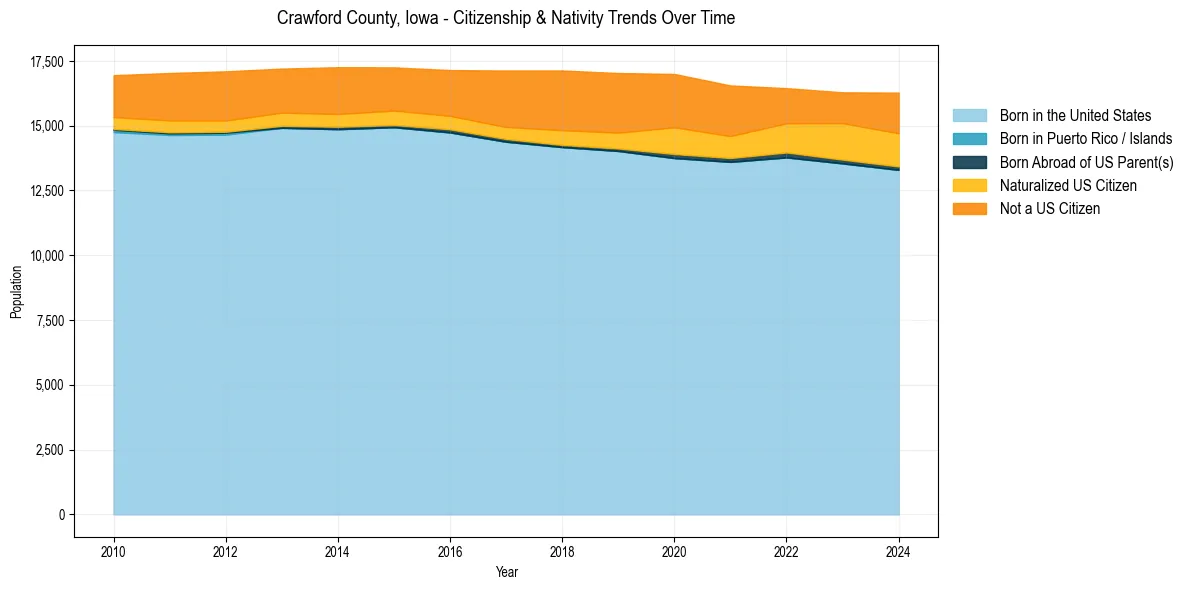
Crawford County, Iowa Population & Nativity History
| Year | Total Pop | Foreign Born | Native Born |
|---|---|---|---|
| 2024 | 16,277 | 17.5% | 82.5% |
| 2023 | 16,289 | 15.9% | 84.1% |
| 2022 | 16,450 | 15.1% | 84.9% |
| 2021 | 16,555 | 16.9% | 83.1% |
| 2020 | 16,998 | 18.2% | 81.8% |
| 2019 | 17,034 | 17.1% | 82.9% |
| 2018 | 17,132 | 16.8% | 83.2% |
| 2017 | 17,131 | 15.4% | 84.6% |
| 2016 | 17,147 | 13.3% | 86.7% |
| 2015 | 17,252 | 12.9% | 87.1% |
| 2014 | 17,259 | 13.3% | 86.7% |
| 2013 | 17,205 | 12.8% | 87.2% |
| 2012 | 17,100 | 13.6% | 86.4% |
| 2011 | 17,035 | 13.4% | 86.6% |
| 2010 | 16,951 | 12.3% | 87.7% |
Nativity & Citizenship FAQs for Crawford County, Iowa
Approximately 17.5% of residents in Crawford County, Iowa were born outside the United States.
The vast majority of residents, roughly 90.4%, are U.S. citizens (including both native-born and naturalized citizens).