Buena Vista County, Iowa Nativity & Citizenship Status (2024)
Place of birth and citizenship status analysis for Buena Vista County, Iowa
Buena Vista County, Iowa Nativity & Citizenship Indicators (2024)
Native Born
78.7%
Foreign Born
21.3%
Naturalized
7.1%
US Citizens
85.9%
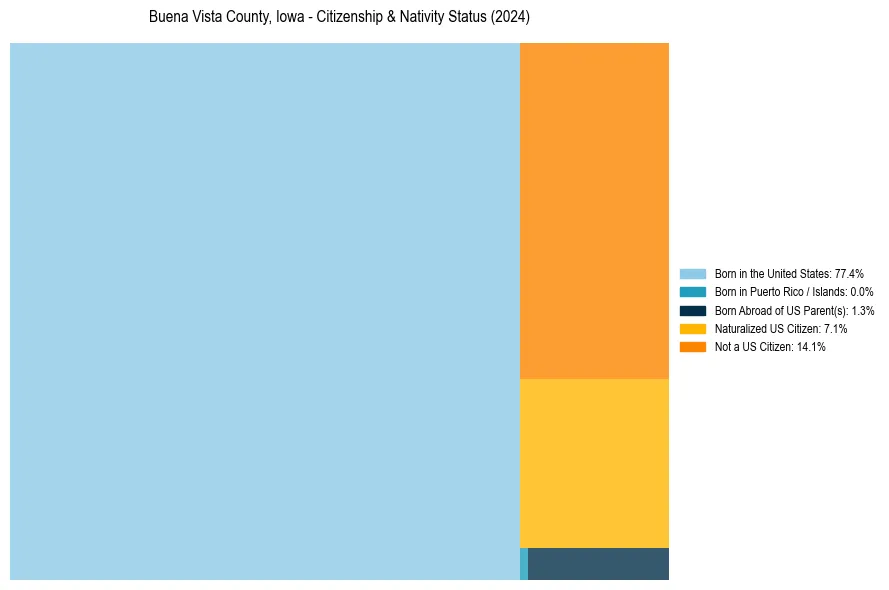
Buena Vista County, Iowa Nativity & Citizenship Distribution
Buena Vista County, Iowa Historical Nativity Trends (2010–2024)
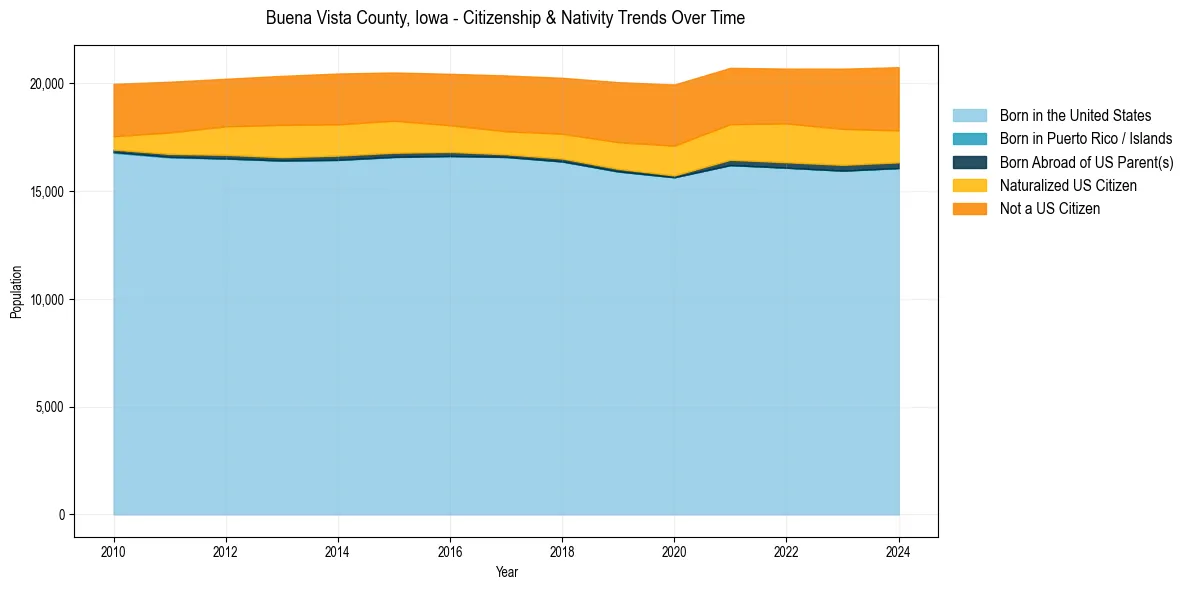
Buena Vista County, Iowa Population & Nativity History
| Year | Total Pop | Foreign Born | Native Born |
|---|---|---|---|
| 2024 | 20,753 | 21.3% | 78.7% |
| 2023 | 20,684 | 21.6% | 78.4% |
| 2022 | 20,687 | 21.0% | 79.0% |
| 2021 | 20,723 | 20.6% | 79.4% |
| 2020 | 19,950 | 21.2% | 78.8% |
| 2019 | 20,058 | 20.1% | 79.9% |
| 2018 | 20,260 | 18.5% | 81.5% |
| 2017 | 20,369 | 18.0% | 82.0% |
| 2016 | 20,445 | 17.7% | 82.3% |
| 2015 | 20,507 | 18.2% | 81.8% |
| 2014 | 20,460 | 18.6% | 81.4% |
| 2013 | 20,350 | 18.6% | 81.4% |
| 2012 | 20,215 | 17.5% | 82.5% |
| 2011 | 20,078 | 16.7% | 83.3% |
| 2010 | 19,980 | 15.3% | 84.7% |
Nativity & Citizenship FAQs for Buena Vista County, Iowa
Approximately 21.3% of residents in Buena Vista County, Iowa were born outside the United States.
The vast majority of residents, roughly 85.9%, are U.S. citizens (including both native-born and naturalized citizens).