Black Hawk County, Iowa Nativity & Citizenship Status (2024)
Place of birth and citizenship status analysis for Black Hawk County, Iowa
Black Hawk County, Iowa Nativity & Citizenship Indicators (2024)
Native Born
93.5%
Foreign Born
6.5%
Naturalized
2.9%
US Citizens
96.4%
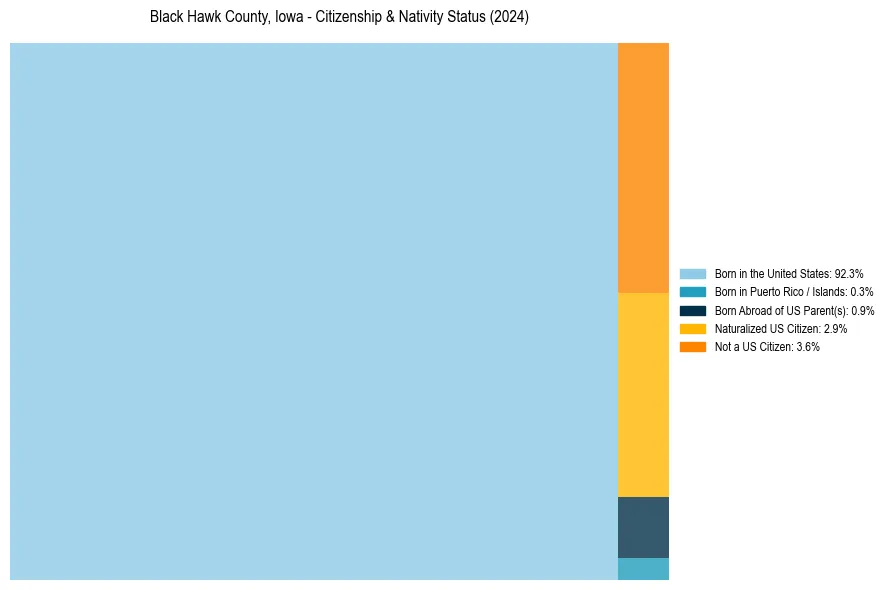
Black Hawk County, Iowa Nativity & Citizenship Distribution
Black Hawk County, Iowa Historical Nativity Trends (2010–2024)
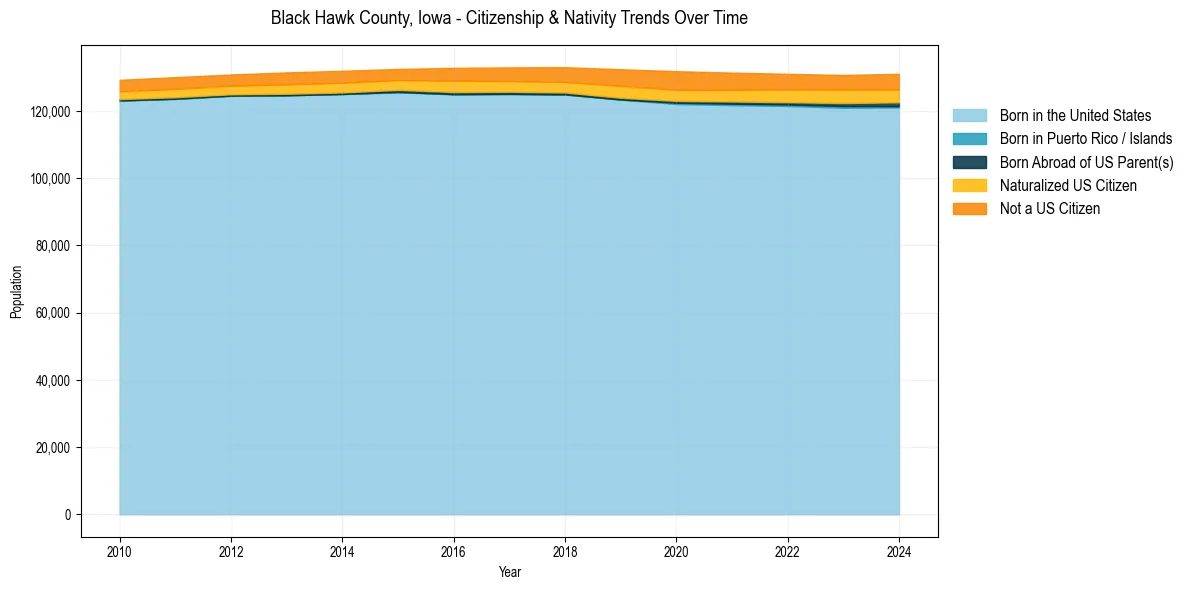
Black Hawk County, Iowa Population & Nativity History
| Year | Total Pop | Foreign Born | Native Born |
|---|---|---|---|
| 2024 | 131,049 | 6.5% | 93.5% |
| 2023 | 130,693 | 6.4% | 93.6% |
| 2022 | 131,041 | 6.4% | 93.6% |
| 2021 | 131,396 | 6.5% | 93.5% |
| 2020 | 131,813 | 6.7% | 93.3% |
| 2019 | 132,393 | 6.4% | 93.6% |
| 2018 | 133,009 | 5.7% | 94.3% |
| 2017 | 132,960 | 5.4% | 94.6% |
| 2016 | 132,821 | 5.4% | 94.6% |
| 2015 | 132,496 | 4.7% | 95.3% |
| 2014 | 131,947 | 4.9% | 95.1% |
| 2013 | 131,468 | 4.8% | 95.2% |
| 2012 | 130,843 | 4.5% | 95.5% |
| 2011 | 130,060 | 4.6% | 95.4% |
| 2010 | 129,252 | 4.4% | 95.6% |
Nativity & Citizenship FAQs for Black Hawk County, Iowa
Approximately 6.5% of residents in Black Hawk County, Iowa were born outside the United States.
The vast majority of residents, roughly 96.4%, are U.S. citizens (including both native-born and naturalized citizens).